Showing posts with label India. Show all posts

Tuesday, October 6, 2015

6/10/15: BRIC Quarterly Economic Activity & PMIs: 3Q 2015


Now, as promised, the summary of 3Q 2015 BRIC PMIs and the insights these give us into global growth trends. Note: series history refers here to data from 1Q 2006, since some countries in the group only started collecting PMI data from that period.

Brazil:

  • Brazil’s Manufacturing PMI averaged poorly 46.7 in 3Q 2015, which is… drum roll… an improvement on disastrous 46.1 recorded in 2Q 2015. All in, Brazil manufacturing sector contraction is now 6 consecutive quarters-long. Over the last two consecutive quarters, Brazil posted the worst Manufacturing sector performance of all BRIC economies. 
  • Meanwhile, Brazil Services PMI tanked to 41.9 on 3Q 2015 average basis from already abysmal 42.3 reading in 2Q 2015. This means that Brazil Services sectors are in a deep contraction over the last 6 months and the rate of contraction accelerated in 3Q 2015. This is the worst quarterly reading in all BRIC economies for Services sector for the second consecutive quarter running and the fourth consecutive quarter of recession in Brazil’s Services. 
  • While Manufacturing PMI in 3Q 2015 was the fifth lowest in history of the series, Services PMI hit its lowest level in history. In brief, Brazil is in deep trouble and is currently the worst performer across both manufacturing and services sectors of all BRIC economies. Brazil recorded now four consecutive quarters of sub-40 readings in both indices - the only economy in the BRIC group to have done so (in Russia case, such coincident sub-50 readings have occurred for the duration of only two quarters) in post-Crisis period.


Russia:

  • Russian Manufacturing PMI averaged 48.4 in 3Q 2015 unchanged on 48.4 reading in 2Q 2015. This is the lowest (tied with 2Q) reading since 1Q 2014 and marks the third consecutive quarter of sub-50 readings in the sector. The level of contraction singled by 48.4 reading is, however, not particularly remarkable, marking the 6th sharpest rate of activity decline in series history.
  • Russian Services PMI posted a reading of 50.7 in 3Q 2015, consistent with weak growth, following 51.0 reading in 2Q 2015 and marking two consecutive quarters of above 50 readings. Growth is still weak in the sector, with 3Q 2015 reading being 9th lowest in series history.
  • Overall, Russian economy is still in a recessionary scenario, judging by PMIs although some improvement is visible in the Services side of the economy. In my view, it is too early to call the bottom of the recession, yet, but there are some potentially encouraging signs emerging.
  • Russia remained the second weakest economy in the BRIC group, only marginally (by about 0.1 points) underperforming China when comparative is taken across both sectors of the economy.


China:

  • Chinese Manufacturing PMI fell off the cliff in 3Q 2015, declining to 47.4 compared to 49.2 in 2Q 2015. This marks second consecutive quarter of sub-50 readings for the index. 3Q 2015 index was 3rd lowest in the history of the series, highlighting just how sharp the deterioration was. Over the last 4 quarters, Chinese manufacturing failed to post a reading above 50.0 in all quarters, meanwhile, over the last 16 quarters, Chinese Manufacturing posted a statistically significant growth reading in only one quarter.
  • China Services PMI fell from 52.7 in 2Q 2015 to 51.9 in 3Q 2015. This is the 5th lowest reading in the history of the series and, although nominally above 50.0, statistically is not consistent with a signal of even moderate growth. 
  • In simple terms, China is getting dangerously close to statistically zero growth across the economy, which, in my view - given the low quality of Chinese official data - can be anywhere around 3-4 percent official GDP expansion for 2015. Potentially - lower. 


India:

  • Indian Manufacturing PMI continued to lead the BRIC economies indices, rising to 52.1 in 3Q 2015 from 51.7 in 2Q 2015. Still, the case of growth is 9th slowest in data series history.
  • Indian Services PMI posted a strong rebound from 49.9 reading in 2Q 2015 to 51.3 in 3Q 2015. Even with this rebound, latest indicator is signalling 10th slowest rate of growth in the Services side of the economy.
  • Overall, India returned to the scenario of broadly based (across both Services and Manufacturing) growth in 3Q 2015. However, considering past performance, growth across both sectors in India was anaemic in 3Q and it has been weak since the start of 2013.


Charts below illustrate key trends:


Overall, BRIC group activity has been pretty disastrous in recent quarters, as shown in the Chart below


As the above illustrates, combined BRIC Manufacturing index is currently running at 48.5 down from 49.4 in 2Q 2015 and marking second consecutive quarter of sub-50 readings. This the third worst performance level for the indicator. Across Services sectors within the BRIC economies, activity also fell in 3Q 2015 (to 50.7) from already weak 50.9 in 2Q 2015. 3Q 2015 Services reading is 5th worst in history.

Table below summarises recent changes in quarterly PMIs:


Key conclusions: 

  • BRIC economies are in a sharp, structural slowdown across both manufacturing and services, with Brazil and Russia lingering in sustained recessions, China effectively falling off the growth cliff and India slowing down, but still generating positive growth. The rot is global - it is driving global trade and currencies imbalances and is also driven by global trade, demand and currencies imbalances. With the world’s largest EMs in deep trouble, one has to wonder how low can global GDP growth revisions go in months ahead.
  • The structural or longer-term nature of this rot is best highlighted in the last chart above, showing clearly the dramatic trend decline in Manufacturing activity starting with 2Q 2011, followed with the onset of decline in Services side of the economy in 2Q 2013.


Note: Monthly PMIs for September were covered in previous posts:
- For Services and Composite PMIs: here.
- For Manufacturing PMIs: here.

6/10/15: BRIC Services & Composite PMI: September 2015


BRIC Services PMIs and Composite PMIs are in for September. I covered Manufacturing PMIs for BRTIC economies earlier here.

Unlike Manufacturing sector, BRIC Services sector did much better, posting overall a shallow, but positive growth.

  • Russia Services PMI was covered in detail in this post. Overall, in the end Russia Services PMI reading for September ended up being tied for the highest position in the entire group alongside India’s
  • India’s Service PMI came in at 51.3, down from 51.8 in August and marking third consecutive month of above 50 readings. The rate of growth singled by the Indian PMI is, however, relatively weak. 
  • China Services PMI came in at 50.5, the second weakest reading for a BRIC economy and down on 51.5 in August. Statistically-speaking, just as with Russian and Indian Services indicator, Chinese Services PMI was not distinguishable from zero growth 50.0 marker. For the economy that never posted below 50 reading in its Services PMIs, however, current reading for China is probably consistent with a sector growth plummeting sharply. This is the lowest rate of activity since July 2014. September reading was also second lowest on record.
  • Brazil Services PMI was the only reading below 50 in the BRIC group and at 41.7 it is a very poor reading and is below August 44.8. Brazil has now posted the weakest of Services PMIs reading for all BRIC economies every month since March 2015.


As Chart above clearly indicates, Brazil weakness is sharp and sustained over some time now. In contrast, Russia has managed some stabilisation in the Services sector with very strong upward correction starting from February 2015 low. Overall, you can also see the extremely compressed and subdued growth activity in the Sector across the BRIC economies starting with 3Q 2013 on. 

Summary table below highlights recent changes in Manufacturing and Services PMIs for the BRIC economies:


Now, let’s consider Composite PMIs.


  • Again, Russia Composite PMI was covered in the separate earlier post here. In comparative terms, Russian Composite PMI was the second highest in the BRIC group after India.
  • India Composite PMI came in at 51.5 in September compared to 52.6 in August, marking a deterioration in the rate of growth in the economy. 51.5 reading is border-line significant in statistical terms, suggesting possibly sharper downturn in the economic activity than simple decline of 1.1 points suggests. Still, India posted the best performing Composite PMI of all BRIC.
  • China Composite PMI came in at disappointing 48.0 in September, down from an already weak 48.8 in August. Last two months readings suggest negative growth in the Chinese economy, although it is hard to call what exactly is happening in the actual economy. Nonetheless, China was a negative drag on the BRIC growth for the second month in a row.
  • Brazil Composite PMI literally is tanking. It hit 42.7 reading in September, down from 44.8 in August. This marks a seventh consecutive month of composite PMI for the country signalling an outright contraction in output. 


Charts above plot BRIC Composite PMIs. Several things worth noting here are:

  1. There is continued divergence in Russian PMIs (to the upside) and BRIC ex-Russia PMIs (to the downside) driven by sharp deterioration in Brazil economic environment over the last 7 months. Local peaking of BRIC ex-Russia PMIs in February 2015 is now fully exhausted and in September, BRIC ex-Russia index took a sharp nosedive. Trendiness reflect this divergence and show that it is currently well-established. In other words, although Russian economy is performing poorly, ex-Russia BRIC economies are performing even worse, even if we include into this sub-grouping a relatively well performing India.
  2. Overall, BRIC Composite PMI is on a sustained downward trend since June 2014 and in July-September 2015 this downward trend accelerated sharply. BRIC Composite PMI now signals recessionary conditions across the whole group of four largest Middle-Income and Emerging Markets economies. On a longer time line, weak performance in the BRIC economies has been now a feature of the global growth environment since the end of 1Q 2013.

I will be covering quarterly PMI signals in the subsequent post, so stay tuned.

Friday, October 2, 2015

2/10/15: BRIC Manufacturing PMI: 7th month of Sectoral Recession in September


Manufacturing PMIs for BRIC countries for September generally remained on the downward trend established some 7 months ago.


  • I have covered Russian Manufacturing PMI earlier here with index reading signalling slower rate of decline in the sector activity in September, rising to 49.1 from 47.9 in August. This is the highest reading in the series since February 2015, but marks 10th consecutive month of sub-50 readings.
  • China Manufacturing PMI was covered in detail here showing a strong signal of continued deterioration in the economy.
  • Meanwhile, Brazil posted a rise in Manufacturing PMI from horrific 45.8 in August to ugly 47.0 in September. This was the eighth consecutive month of sub-50 readings in Brazil Manufacturing sector, with extremely weak performance setting in back in Q 2014 and continuing basically without interruption since then. Per Markit, “although rates of contraction in new orders and production eased, the downturn remains sharp. Companies continued to shed jobs and reduce inventory levels.” Quarter performance was poor, but I will cover this in a separate post. Brazil is now the worst performing BRIC economy in Manufacturing sector activity for 8 months running.
  • India continued to break the BRIC trend, posting another above 50 PMI reading for Manufacturing Sector. India Manufacturing PMI in September was running at 51.2, down from 52.3 in August and marking the slowest pace of growth in seven months, “mirroring a slower increase in new orders. Staffing levels were, consequently, reduced and purchasing activity rose at the weakest pace since December 2013. …New business from abroad expanded at the slowest pace in the current 24-month sequence of growth and one that was marginal overall.”


Table below summarises key readings:


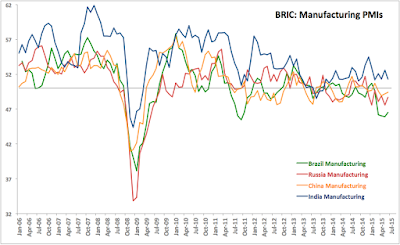
Chart below illustrates key trends:


Overall, Manufacturing activity remains on a downward trajectory in 3 our of 4 BRIC economies, with negative trends accelerating in the case of China (second worst performer for the third month in a row), remaining steady in the case of Brazil (worst performer over last 8 months), slightly moderating in terms of contraction in Russia (third worst performer over the last three months). Meanwhile, growth in India is declining toward anaemic levels of activity. 

Thursday, September 3, 2015

3/9/15: BRIC Composite PMI: August

Having covered Manufacturing (link here) and Services PMIs (link here) for BRIC countries, consider Composite PMIs next.

Note, to make series consistent with my previous indicator, I use x2 factor on composite PMI readings from Markit, going forward, so reference number here is not 50.0 but 100.0.


  • Brazil Composite PMI firmed up marginally to 89.6 in August from 86.3 in July. This is the fifth highest reading in recent months, but sixth consecutive reading below 100. Per Markit: "Rising to a five-month high… the Brazil Composite Output Index pointed to a further, although weaker, decline in private sector output. Whereas manufacturing production decreased at a quicker rate, the reduction in service sector activity softened. … New business in the Brazilian service sector decreased for the sixth straight month in August. …Order book volumes at manufacturers dipped at the fastest pace in four years. Subsequently, the contraction in total private sector new work accelerated to the sharpest in three months."
  • Russian Composite PMI was also soft, falling to 98.6 in August compared to 101.8 in July, returning the economy toward renewed recessionary momentum after fragile improvement in the first month of 3Q 2015. More on Russian Composite PMI here: http://trueeconomics.blogspot.ie/2015/09/3915-russian-manufacturing-services.html.
  • China Composite PMI too posted sub-100 reading, falling to 97.6 in August compared to 101.6 in July. Per Markit release: "Though only modest, it was the fastest contraction of output seen since February 2009. The renewed decline in overall output was largely driven by a faster contraction of manufacturing production in August. Furthermore, the latest fall in manufacturing output was the quickest seen in 45 months. Meanwhile, slower growth in service sector business activity also weighed on the headline index. Consequently, total new business at the composite level fell for the first time since April 2014, albeit marginally. ...the latest expansion in service providers’ staff numbers was the weakest seen in the current two-year sequence of job creation and fractional. Job shedding persisted at manufacturing companies, with the pace of reduction quickening slightly since July. Overall, composite employment fell for the third month in a row and at a modest pace."
  • India Composite PMI firmed up to 105.2 from 104.0 in July, marking improved growth outlook for the economy and breaking, once again, trend with the rest of the BRICs. Per Markit: "India’s private sector economy improved further in August. The seasonally adjusted Nikkei India Composite PMI Output Index rose to a five-month high… The uptick in growth was boosted by a quicker expansion of services activity, as the increase in manufacturing production softened in August. …New business across the private sector as a whole expanded at a moderate pace that was the quickest since March."


SUMMARY: As charts above show, BRICs as a block are now exerting negative drag on the global economy. This is extremely worrying especially as the core drivers for this weakness are now China and Brazil, opposed to Russia. While Russian economy remains in a recession, overall, it is responsible for lesser share of negative momentum in the BRICs index than the other two troubled economies since around the start of 2Q 2015.

3/9/15: BRIC Manufacturing PMIs: August

BRICs manufacturing PMIs signalled continued worsening in growth conditions in world's largest emerging markets.


  • Brazil Manufacturing PMI fell to an abysmally low 45.8 in August compared to already poor 47.2 in July. This marks the fastest rate of decline in manufacturing activity in the economy since September 2011 and the 7th consecutive month of sub-50 readings in the index.
  • Russia Manufacturing PMI fell to 47.9 from 48.3 in July, marking 9th consecutive month of sub-50 readings and worst performance in the sector since May 2015. August move effectively demolished previous expectations of stabilisation in Manufacturing sector in Russia. In my previous posts on the subject I have consistently noted that early signs of such stabilisation were yet to be fully confirmed and we will have to wait until we see Services PMI for Russia for more analysis.
  • India Manufacturing PMI continued above-50 trend performance in August, although the index did fall to 52.3 from 52.7 in July. Statistically-speaking, 51.5 for the Indian economy is consistent with moderate growth. Overall, Indian Manufacturing PMIs have now been in continuous expansion territory over 22 consecutive months.
  • China Manufacturing PMI came in at a disappointing 47.3 in August, down on already poor 47.8 in July, marking 6th consecutive month of contraction in the sector. Overall, August reading is the lowest since March 2009. The trend suggests the economy is nowhere neat the target of 7% annual growth rate targeted by the Beijing officials.


Summary view: Overall, BRIC Manufacturing PMIs signalled deepening of the ongoing economic growth slowdown in the largest emerging economies. We will need to wait for the analysis of Services and Composite PMIs to confirm this, but August has been a disappointing month for the prospects of global growth recovery.

Wednesday, August 5, 2015

5/8/15: BRIC Composite PMIs: July 2015


I covered BRIC economies' Manufacturing PMIs for July here: http://trueeconomics.blogspot.ie/2015/08/4815-bric-manufacturing-pmis-july-2015.html.

Now, let's take a look at Services PMIs and Composite.

  • Brazil Services PMI fell from an extremely poor 39.9 in June 2015 to an abysmal 39.1 in July, reaching a joint historical low (total history for the series spans 101 months). July reading was so poor, 3mo average through last month fell to 40.5 against 3mo average through April 2015 at 48.3 and 3mo average through July 2014 at 50.7.
  • Per Markit: "The downturn remained widespread across the services categories covered by the survey, with all of the sub-sectors registering substantial falls in business activity. The steepest contraction was at Hotels & Restaurants, followed by Transport & Storage. The level of new business in the service economy decreased for the fifth straight month in July. The pace of reduction was slightly faster than in the prior month, but nonetheless still less severe than in May (when new business fell at the quickest pace since April 2009). 
  • Brazil's woeful Services PMI was compounded by a drop in Manufacturing (see summary of both below), driving official Brazil Composite PMI deep into contraction territory at 40.8 against already extremely low 41.0 in June. Overall, Composite index has hit the lowest point since March 2009.
  • Overall: there is absolutely no doubt that both Services and Manufacturing are currently in a recession, with below 50 readings in both sectors present since March 2015
  • Russia Services PMI strengthened from 49.5 in June to 51/6 in July marking the return to growth in the sector. On a 3mo average basis, July 2015 reading was at 51.3, well ahead of 3mo average through April 2015 (46) and 3mo average reading through July 2014 (48.5). 
  • However, Russian Manufacturing PMI (see separate coverage here: http://trueeconomics.blogspot.ie/2015/08/3815-russia-manufacturing-pmi-july-2015.html).
  • The respective Russian Composite Output Index improved to 50.9 in July, up from 49.5 in the preceding month. Per Markit: "Supporting the rise in overall activity for the service sector was a fourth consecutive month of increasing volumes of incoming new business. Moreover, the rate of growth accelerated to the highest recorded for twenty months amid reports that a more positive economic climate was driving demand for services upwards."
  • More details on both Russia Composite PMI and Services PMI here: http://trueeconomics.blogspot.ie/2015/08/5815-russian-services-composite-pmis.html.
  • Overall: these are some tentative early-stage signs of economic stabilisation and possibly recovery. Too early to call a new trend, however, and any talk of real recovery will require sustained rise in Manufacturing PMI above 51-51.5 mark.
  • China Services PMI posted yet another above 50 reading (the Index never once dipped below 50.0 mark) rising strongly from 51.8 in June to 53.8 in July. This is the strongest reading in the Index since August 2014 and brings 3mo average through July 2015 to 53.0, up on 52.4 3mo average through April 2014 and on 51.3 3mo average through July 2014.
  • Sub-50 reading in Manufacturing PMI reflective of further worsening in manufacturing downturn in the economy (ongoing since November 2014 with a brief interruption in February 2015) meant that China Composite PMI posted "only fractionally above the neutral 50.0 mark at 50.2, down from 50.6 in June, and pointed to the weakest rate of expansion in 14 months."
  • Overall: China remains on slower growth path with Manufacturing under significant pressure. This trend is linked to the fortunes of global trade flows (more so than Services) and to weakening investment outlook for Chinese firms.
  • India Services PMI rose to 50.8 in July, marking a very shallow recovery in the sector and breaking two months streak of sub-50 readings. July reading was up on 47.7 in June and on a 3mo average basis, figures through July 2015 are at 49.4 - signalling weak contraction against 3mo average through April 2015 at 53.1 and 3mo average through July 2014 at 52.3.
  • Strong Manufacturing performance in PMI terms and weak, but above 50 reading in Services provided upside support for the Composite PMI. Per Markit: "After having fallen in the previous month, output across the combined manufacturing and service sectors in India rose during July. The seasonally adjusted Nikkei India Composite PMI Output Index climbed to 52.0 from 49.2 in June to signal a modest increase in activity. Growth has now been recorded in 14 of the past 15 months. The return to expansion was helped by a first rise in services activity in three months and an acceleration in the rate of manufacturing production growth."
  • Overall: India regained its strong performance dynamic in July across both sectors, with relatively weaker performance in Services. Indian economy currently leads the BRIC group in terms of growth momentum as signalled by PMIs.

Summary of changes across both Manufacturing and Services PMIs is provided below:


And chart for Services PMIs illustrates: 

Overall, BRIC activity as contributor to global growth has improved, remains weak. In June, the BRIC group of economies was contracting and exerting downward pressure on global growth. However, in July, they made a positive contribution, albeit extremely shallow.


In recent months, it has become customary for BRIC economies analysts to suggest that Russia is the weakest component to BRIC activity. However, while this assertion was true through 1Q 2015, it is no longer holding since then:


This, however, is of little consolation to an economy in a recession.

Tuesday, August 4, 2015

4/8/15: BRIC Manufacturing PMIs: July 2015


Markit released Manufacturing PMIs for July for all BRIC countries, so here is the snapshot of the data:

  • Brazil Manufacturing PMI rose marginally to 47.2 in July from 46.5 in June, marking 6th consecutive month of manufacturing activity in contraction (below 50.0), with five of these months PMIs statistically significantly below 50.0. 3mo average though July is now at extremely low 46.1 against 3mo average through April 2015 at 47.3 and 3mo average through July 2014 at 48.9.
  • Russia Manufacturing PMI fell from 48.7 in June to 48.3 in June - details are covered separately here: http://trueeconomics.blogspot.ie/2015/08/3815-russia-manufacturing-pmi-july-2015.html
  • China Manufacturing PMI fell to 47.8 in July from 49.4 in June, signalling deterioration in sector performance and marking fifth consecutive month of contraction in the sector. This is the worst reading in the index since July 2013. 3mo average through July is now at 49.2 against 49.7 3mo average through April 2015 and 50.6 3mo average though July 2014.
  • India Manufacturing PMI was the only PMI for the BRIC economies that stood above 50.0 in July, rising from 51.3 in June to 52.7 in July. This marks 21st consecutive month of above 50.0 readings. 3mo average through July 2015 is now at 51.7 (barely at statistical significance line) against 3mo average through April 2014 at 51.5 and 52.0 3mo average through July 2014.
  • Three out of four BRICs economies have now been in Manufacturing activity decline territory every month since March 2015. 
  • Based on 3mo averages, growth in May-July 2015 is down compared to same period in 2014 in all four BRIC economies.


Summary: BRIC manufacturing remains deep under water, with three of the four economies struggling with contracting manufacturing sector activity. Which is consistent with poor global trade performance (http://trueeconomics.blogspot.ie/2015/08/2815-global-trade-welcome-to-economic.html).

Thursday, July 9, 2015

9/7/15: BRIC Composite PMIs: June 2015 & 2Q 2015


In the previous post covering Manufacturing & Services PMIs for BRIC economies, I promised to provide a separate summary of composite PMI-signalled activity.

Here is the summary of both Services and Manufacturing PMIs moves in June:


On a simple cumulative basis (unweighted by sector weights, not to be confused with Markit's Composite PMI):

  • Brazil composite activity stood at 86.4 in June, down from 88.4 in May. 2Q 2015 average was 88.5 against 98.4 for 1Q 2015 and down from 99.7 for 2Q 2014. In short - we have ongoing and worsening slowdown in activity across both sectors combined, with the fourth consecutive month of the combined reading below expansion line (100).
  • Russia composite activity stood at 98.2 in June, down from 100.4 in May. 2Q 2015 average was 99.4 - an improvement on 92.2 for 1Q 2015 and better than 96.4 recorded for 2Q 2014. The ongoing slowdown is moderating, with activity across both sectors combined showing slower rates of contraction in 2Q 2015. That said, combined activity has been posting contractionary signals in 8 out the last 9 months.
  • India composite activity fell to 99.0 in June, posting the first month of sub-100 reading since April 2014, down from 102.2 in May. 2Q 2015 average was 101.6 against 105.4 for 1Q 2015 and down from 102.4 for 2Q 2014. This implies that Indian economic activity growth was posting a significant slowdown q/q and y/y in 2Q 2015.
  • China composite activity stood at 101.2 in June, down from 102.7 in May. 2Q 2015 average was 101.9 virtually unchanged against 102.0 for 1Q 2015 and up slightly on 101.1 for 2Q 2014.  China's economy was the only economy in the BRIC group that remained above the 100 line in June.

Charts below illustrate the latest trends:


In summary, things are getting worse, progressively across the BRIC economies, with Russia, surprisingly, presenting an upside momentum to the overall group growth dynamics. That said, the trends are yet to be fully established for Russia. Overall, BRICs have now running along the negative growth trend for some time and BRIC combined (weighted by each economy share of total group GDP) momentum is at 99.0 in June, marking the first sub-100 reading since May 2014. 3mo average through 2Q 2015 is at 100.3, down on 1Q 2015 average of 101.4 and down on 2Q 2014 average of 100.8.

9/7/15: BRIC Manufacturing & Services PMIs: June 2015 & 2Q 2015

With BRICS summit on its way, an updated post on BRIC PMIs (data from Markit):

Brazil:

Manufacturing PMI stood at 46.5 in June, singling sharp rate of contraction that was somewhat slower than the decline in May (45.9). Per Markit, "new orders and output both drop at sharp rates; inflationary pressures ease." June PMI was the highest in four months and marks the fifth consecutive month of sub-50 readings. 3mo average is now at 46.1 against 3mo average through March at 48.8 and 3mo average through June 2014 at 48.9.

Services PMI also came in at disappointing levels, falling to an abysmally low 39.9 in June from already low 42.5 in May. This marks the lowest reading in Services PMI since March 2009 and the second lowest reading in Services PMI in history.

As noted by Markit, "Private sector jobs cut at quickest pace for over six years; Steep, but slower, contraction in new orders received by private sector firms."

With 4th consecutive month of sub-50 readings, services PMI averaged 42.3 in 3mo period through June 2015, compared to 49.5 average for the 3mo period through March 2015 and 50.8 for the 3mo average through June 2014.

Overall, "Brazil’s private sector economy registered its sharpest retreat since March 2009. Down from 42.9 in May to 41.0 in June, the Composite Output Index was indicative of a steep drop in activity, with sharp falls seen at both service providers and manufacturers."

Russia:

Russian PMIs are covered in detail here: http://trueeconomics.blogspot.com/2015/07/4715-russia-services-and-manufacturing.html?spref=tw and summarised below in the table.

India:

India's Manufacturing PMI came in at 51.3, signalling weak-to-moderate expansion of manufacturing output and down from 53.5 in May. On a 3mo average basis, June 2015 PMI was at 51.7 - marginally slower than 3mo average of 52.1 for the period January-March 2015 and slightly ahead of 51.4 3mo average registered through June 2014. Markit noted that June figures presented the "slowest rise in new work since September 2014; Negligible increases in input costs and output charges."

On Services PMI side, June reading of 47.7 marks second consecutive month of sub-50 readings and a sharpening in the downturn from 49.6 in May 2015. 3mo average through June 2015 is now at 49.9 against 3mo average through March 2015 of 53.1 and 3mo average through June 2014 at 51.0. Services PMI is now sitting at the lowest level since March 2014.

Per Markit: "Falling to 49.2, from 51.2 In May, the seasonally adjusted Nikkei India Composite PMI Output Index recorded below the crucial 50.0 threshold for the first time since April 2014. Reductions in activity were centred at service providers, as manufacturing production rose during the month."

China:

HSBC Purchasing Managers’ Index for manufacturing posted at 49.4 in June. This was the fourth successive, marginally up on 49.2 in May. This marks 4th consecutive month of Chinese manufacturing PMI readings below 50. Per Markit release, "Output contracts at slower pace as new orders show signs of revival" but "Staff numbers are cut at sharpest rate since February 2009." 3mo average through June 2015 was 49.2 down from 3mo average for 1Q 2015 AT 50.0 and lower than 49.4 3mo average through 2Q 2014.

On services side, PMI posted a significant "moderation in the rate of service sector activity growth. Moreover, it was the slowest expansion in services business activity since January, as signalled by the HSBC China Services Business Activity Index posting 51.8, down from May’s eight-month high of 53.5." However, 3mo average for services was at 52.7 in June 2015, compared to 52.0 in 3mo period through March 2015 and 51.7 for the 3mo average through June 2014.

"HSBC China Composite PMI™ data (which covers both manufacturing and services) pointed to a further rise in total business activity in China during June. However, the rate of expansion eased to a marginal pace that was the slowest recorded since May 2014. This was signalled by the HSBC Composite Index posting only slightly above the neutral 50.0 mark at 50.6 in June, down from 51.2 in May."

CHARTS


As shown in the charts above, growth conditions remain negative in 3 out of 4 BRIC economies in Manufacturing and Services. No single BRIC economy is posting broad cross-sectoral growth in June and on quarterly averages basis, 
  • Brazil is running negative growth signals in both Services and Manufacturing;
  • Russia and China are running negative growth in both Manufacturing;
  • India is running negative growth in Services.
This contrasts with 1Q 2015 when Brazil and Russia were posting negative growth across both Services and Manufacturing, while India and China were posting positive growth across both sectors.

Things are getting tougher in the BRICs...

Stay tuned for composite analysis and summary next.

Tuesday, June 2, 2015

2/6/15: BRIC Manufacturing PMI: Continued Pain in May


Things got pretty ugly for Manufacturing sector across the BRIC economies in April, and the trend continues into May. The latest data from Markit shows that:

  • Brazil Manufacturing PMI slipped marginally from strongly contractionary 46.0 in April to 45.9 in May. 3mo average through May is now at an abysmal 46.0 against 3mo average through February at 50.2, 3mo average through May 2014 was 49.6. All in, this is the fourth consecutive month of sub-50 readings and adjusting for statistical significance, PMI index rose above 50.0 only once over the last 16 months. This May reading is the lowest for any month since September 2011.
  • Russia Manufacturing PMI fell from a contractionary 48.9 reading in April to a very poor 47.6 in May. 3mo average through May is now at 48.2 - not a disaster, but poor - against 3mo average through February at 48.7, 3mo average through May 2014 was 48.6. All in, this is the sixth consecutive month of sub-50 readings and adjusting for statistical significance, PMI index rose above 50.0 only once over the last 9 months. May 2015 reading ties for the lowest level of PMI for the Russian economy since June 2009.
  • China Manufacturing PMI rose marginally from a contractionary 48.9 reading in April to a still sub-50 reading of 49.2 in May. 3mo average through May is now at 49.2 - a poor reading for the economy - against 3mo average through February at 50.0, 3mo average through May 2014 was 48.5. This May marks the third consecutive month of sub-50 readings and adjusting for statistical significance, PMI index rose above 50.0 last time in July 2014.
  • India Manufacturing PMI continued to buck the BRIC trend, staying above 50.0 mark, albeit slipping from 53.0 reading in April to 52.6 in May. 3mo average through May is now at 52.0 against 3mo average through February at 52.9, 3mo average through May 2014 was 51.3. All in, this is the 19th consecutive month of above-50 readings.


Overall, three out of four BRIC economies posted sub-50 PMIs for Manufacturing in May, for the third consecutive month in a row, while the fourth BRIC economy (India) posted slowdown in the rate of positive growth in the sector.

Tuesday, May 5, 2015

5/5/15: BRIC Manufacturing PMI: Further Growth Slowdown in April


BRIC manufacturing PMIs (Markit) are out for April, and the signs are poor in terms of economic growth prospects for the block of the four largest emerging economies.


  • Brazil manufacturing PMI came in at 46.0 in April, down from already abysmal 46.2 in March, singling deepening and accelerating contraction. This the the third consecutive month of Manufacturing PMI below 50.0. 3mo average is at 47.3 and previous 3mo average (through January 2015) is at 49.9. The weakness in Brazil manufacturing sector performance is not new: in 3mo through April 2014 the index reading was just 50.1. Weak growth or contraction (below 51.0) has been recorded every month since March 2013. As of April, Brazil has posted the lowest monthly and 3mo average readings for Manufacturing PMIs for all BRIC countries.
  • Russian Manufacturing PMI posted a slight improvement in April, rising to 48.9 from 48.1. Nonetheless, April was the fifth consecutive month of sub-50 readings and the 'improvement' is reflective of a slowdown in the rate of contraction, not a reversal of contraction. 3mo average through April is at 48.9 which is still worse than the 3mo average through January 2015 (49.4) and only marginally better than 3mo average through April 2014 (48.4). Last time Russian manufacturing PMI reading was in healthy territory was November 2014 when it posted a surprising reading of 51.7, but overall, weak performance can be traced back to July 2013.
  • Chinese Manufacturing PMI continued to post contraction in the sector coming in at 48.9 in April, marking worsening in the growth conditions compared to 49.6 reading in March and the second consecutive month of sub-50 readings. 3mo average is now at 49.7, marginally weaker than 49.8 3mo average through January 2015. Current 3mo average is, however, stronger than 48.2 average for the 3 months through April 2014.
  • India was the only BRIC economy that managed to sustain above-50 reading for the Manufacturing PMI. However, at 51.3 in April, the PMI is still down on 52.1 in March. This marks 18th consecutive monthly above-50 reading for the series.


Overall, April data indicates significantly adverse conditions in BRIC manufacturing, with Brazil being by far the worst performer in the group both in terms of monthly reading and 3mo average. As the chart above shows, excluding India, BRIC Manufacturing PMIs trend to the downside from mid-2014 levels with Brazil readings at the worst levels since September 2011, Russia continuing to perform at the levels consistent with the worst economic slowdown since October 2008-July 2009, China showing renewed weaknesses consistent with overall zero growth trend present since around Q2 2013. India bucked the BRIC pattern by posting a positive growth trend since Q4 2013.

Monday, April 6, 2015

6/4/15: BRIC Services PMIs & Overall Activity in Q1 2015


BRIC Services PMIs (published by Markit) are finally out, with the last two countries instalments today, so time to look at the Q1 2015 data. And from the top level view, things are not encouraging:

  • Brazil Services PMI slipped from 52.3 in February (a 14-months high that was a huge upside surprise) to a 70-months low of 47.9 in March - a massive fall. On a quarterly basis, things are not as bad, but that is all down to February reading. 3mo average for Q1 is at 49.5 - still contractionary/zero growth, compared to 49.3 Q4 1024 average and against weak growth recorded in Q1 2014 (50.5 average). In last 8 months, Brazil managed to post only two months of Services PMIs above 50, with only one month reading being statistically significantly above 50.0. In short, we now have a sign of deepening slowdown in the economy, based on both Manufacturing and Services surveys.
  • Russia Services PMI was predictably weak at 46.1 in March, although a gain on totally abysmal 41.3 reading in February. 3mo average through Q1 2015 is at 43.8 and this is well below already contractionary 47.1 average through Q4 2-14. Q1 2014 registered a weak contraction/static growth of 49.6. March reading was the strongest in 5 months, but overall Services side of the Russian economy has posted below 50 survey readings continuously over 6 months now. This, coupled with another (4th monthly) below 50 reading in Manufacturing suggests that there is an ongoing significant recession in the economy and that this has accelerated in Q1 2015 compared to Q4 2014.
  • China Services PMI remained in relatively moderate growth territory in March (at 52.3 against 52.0 in February) and 3mo average for Q1 2015 is at 52.0, weaker than Q4 2014 average of 53.2, but up on Q1 2014 average of 51.2. China never posted below 50 PMI in Services before , so we are left tracking relative weaknesses in positive growth signals here. Weak improvement in Services survey is offset, in China's case, by strong deterioration in Manufacturing index which fell below 50 in March.
  • India Services PMI was somewhat weaker in March 2015 at 53.0 compared to February 53.9 reading. Still, this marks the second highest reading in 9 months. India's Services PMI average for Q1 2015 is at 53.1 - a major improvement on 51.3 average through Q4 2014 and a big gain y/y - in Q1 2014, Services PMI was averaging only 48.2. March marked 11th month of above 50 readings for Indian Services surveys. India is the only BRIC country that managed to post m/m growth (above 50 readings) across both sectors: Manufacturing and Services.


Chart below shows Services surveys dynamics:


Table below summarises changes in Manufacturing and Services PMIs:


Pooling together Services and Manufacturing surveys data, chart below shows the overall BRIC trend in growth. March came in with a slowdown of overall economic activity across the block of the largest emerging markets economies and this slowdown took place in the already weak growth environment. While the series remain on an upward trend established from the local low attained in July 2013, this trend is no longer convincing and since June 2014, there has been a pronounced downward sub-trend. This does not bode well for the global economy.


Thursday, April 2, 2015

2/4/15: BRIC Manufacturing PMI: March Marks Further Slowdown in Growth


Markit released Manufacturing PMI for India, so here is a full update on Manufacturing sector indicators across the BRIC economies:

  • Brazil Manufacturing PMI fell to 46.2 in March from 49.6 in February, marking the second consecutive month of sub-50 readings. 3mo average through March was 48.8 against 3mo average through December 2014 at 49.3 and 3mo average through March 2014 at 50.6. The trend is down and getting worse. Brazil registered the sharpest rate of contraction in PMI of all BRIC economies.
  • Russia Manufacturing PMI also came in at disappointing 48.1, down from 49.7 in February, marking the 4th consecutive month of sub-50 readings. Russia posted the second sharpest contraction in manufacturing of all BRIC economies and the sharpest on a 3mo average basis. 3mo average through March was 48.5, down from 50.3 for the 3 months through December 2014, but up on 48.3 3mo average through March 2014.
  • China Manufacturing PMI came in at 49.6 in March, the first reading below 50.0 after 50.7 was registered in February 2015. However, over the last 6 months, Chinese manufacturing posted 3 months of sub-50 readings and one month of 50.0 reading. 3mo average through March stood at 50.0 - basically zero growth signal, against 3mo average through December 2014 at 50.1 (again, zero growth) and 3mo average through March 2014 of 48.7.
  • India posted the only rise in PMI and the only case of manufacturing PMI above 50.0. March reading was 52.1, a gain on 51.2 in February, marking 17th consecutive month of above-50 readings. 3mo average through March was 52.1, which is poorer than 3mo average through December 2014 (52.6) but an improvement year-on-year (3mo average through March 2014 was 51.7).
Chart and table to summarise:


Overall, with exception of India, all BRIC Manufacturing PMIs are now below 50.0 and all are trending down since July 2014 on. Brazil is now the worst performing country in the group, for the second month in a row.

Data presented by Markit signals a deepening slowdown in March compared to February in the group of core emerging markets, which does not bode well for global growth outlook.

2/4/15: BRIC: Business Outlook 12 months ahead


Summary of BRIC economies Business Outlooks for 12 months ahead, via Markit:

India: "The Markit India Business Outlook survey points to sustained optimism among Indian companies. However, the net balance of +26 percent for overall output is the lowest in one year and below the both the BRIC and global averages. Weaker degrees of sentiment have been recorded across the manufacturing and service sectors, with the respective net balances registering +24 and +28 percent in February."


Russia (covered in more detail here: http://trueeconomics.blogspot.ie/2015/04/2415-russia-business-outlook-q1-2015.html): Overall private sector outlook forward has improved at the mid-point of Q1 2015 compared to the start of Q4 2014 as headline % of companies expecting an increase in next 12 months minus % expecting a decline has risen to +20% from Q4 2014 record low of +10%. The net balance for expected goods production over the next 12 months has risen to +35%, the highest since October 2013." We are seeing effects of imports substitution.


China: "…continued optimism at Chinese companies regarding future business activity". "February’s net balance of +30 percent is up from +26 percent in the autumn to the highest reading in a year. The latest reading is also above both the BRIC and global averages (+28 percent and +27 percent, respectively). …A net balance of +28 percent of goods producers anticipate an expansion of output over the coming year, up from +25 percent in October. Meanwhile, a net balance of +32 percent of service providers forecast business activity to increase in the next 12 months. This is the highest net balance seen in the service sector since mid-2012."

Brazil: "private sector companies remain optimistic towards output growth in the coming 12 months. However, the business activity net balance has slipped from +44 percent last October to +28 percent, its lowest reading since composite data were first available in October 2009. Sentiment has deteriorated at manufacturers and service providers."

As the chart below summarises, BRIC expectations are more subdued than those in the major advanced economies, with exception for Japan and the US.

Click on the chart to enlarge

Overall, this data shows consistent trend toward moderation in business expectations across the BRIC economies into Q1 2015, signalling growing downside risks to global growth. So far, ex-India (yet to be reported), Manufacturing data for March PMI surveys suggests this trend continuing through the end of Q1.

Friday, March 13, 2015

13/3/15: Irish Bilateral Trade in Goods with BRIC: 2014


Full year 2014 data on Irish bilateral trade in goods with the BRIC countries is showing some interesting changes to historical patterns worth highlighting. Let's start with country-specific analysis:

Russia: 


Irish exports to Russia (goods only) reached EUR722 million in 2014, up 13.3% y/y from EUR637 million in 2013. Over the last five years, Irish exports to Russia almost doubled, rising 198%. Russia now accounts for 21.6% of Ireland's total exports to BRIC economies, up from 8.2% in 2009. Trade balance with Russia (goods only) has risen more modestly to EUR496 million, up just 1.43%, marking the second highest bilateral trade balance with Russia (the highest one was achieved in 2012 at EUR503 million). Still, Ireland's trade balance with Russia is the largest for all BRIC and Irish exports to Russia now exceeds the combined exports from Ireland to Brazil and India for the fourth year in a row. Over the last 5 years, cumulative trade in goods surplus in favour of Ireland in trade with Russia stands at EUR2.085 billion.

Brazil:


Irish exports to Brazil fell from EUR262 million in 2013 to EUR256 million in 2014 (a drop of 2.3% that effectively reverses the rise of 2.34% recorded in 2013). As the result, 2014 exports to Brazil exactly matched EUR256 million level of exports achieved in 2013. Over the last 5 years, Irish exports to Brazil have grown only 21.2% cumulatively - the second worst performance in BRIC. As the result of sharper contraction in imports, Irish trade balance with Brazil actually managed to improve in 2014. 2014 trade in goods surplus for Ireland's trade with Brazil was EUR97 million as opposed to a deficit of EUR12 million recorded in 2013 and a deficit of EUR260 million recorded in 2012. Over the last 5 years, cumulative trade in goods deficit against Ireland in trade with Brazil stands at EUR7.9 million.


India:


Irish exports to India fell from EUR304 million in 2013 to EUR248 million in 2014 (a drop of 18.4% that significantly reverses the rise of 29.4% recorded in 2013). As the result, 2014 exports to India almost matched EUR235 million level of exports achieved in 2013. Over the last 5 years, Irish exports to India have grown only 56.5% cumulatively - the second best performance in BRIC after Russia. As the result of a small rise in imports, Irish trade balance with India actually managed to deteriorate in 2014. 2014 trade in goods deficit for Ireland's trade with India was EUR154 million as opposed to a deficit of EUR83 million recorded in 2013 and a deficit of EUR130 million recorded in 2012. 2014 was the worst deficit year in our bilateral trade with India since the data on bilateral trade became available in 1998. Over the last 5 years, cumulative trade in goods deficit against Ireland in trade with India stands at EUR673.7 million.


China:

Irish exports to China rose from EUR1,941 million in 2013 to EUR2,111 million in 2014 (a rise of 8.8% that largely reverses the fall of 10.4% recorded in 2013). As the result, 2014 exports to China almost matched EUR2,167 million level of exports achieved in 2013. Over the last 5 years, Irish exports to China have shrunk by 9.4% cumulatively - the worst performance in BRIC. Adding insult to the injury, as the result of a small rise in imports, Irish trade balance with China actually managed to deteriorate in 2014. 2014 trade in goods deficit for Ireland's trade with China was EUR1,370 million as opposed to a deficit of EUR1,150 million recorded in 2013 and a deficit of EUR693 million recorded in 2012. 2014 was the worst deficit year in our bilateral trade with China since 2008. Over the last 5 years, cumulative trade in goods deficit against Ireland in trade with China stands at EUR3,849 million.


Combined bilateral trade with BRIC:


Irish exports to BRIC markets (goods only) rose to EUR3,337 million in 2014, rising 6.2% y/y from EUR3,114 million in 2013 and virtually reversing the losses sustained between 2013 and 2012 to almost match 2011 level of EUR3,324 million. Over the last 5 years, exports from Ireland into BRIC economies rose 13.4% cumulatively - hardly an impressive performance. Meanwhile, Irish imports from BRIC rose from EUR3,900 million in 2013 to EUR4,268 million in 2014. As the result, Irish trade deficit with BRIC economies rose from EUR756 million in 2013 to EUR931 million in 2014. Thus, 2014 marked the worst trade deficit with BRIC economies since 2008. 5 year cumulative trade deficit between Ireland and BRIC currently stands at EUR2,445.8 million


Quite surprisingly, Irish bilateral trade in goods with Russia - subject to EU sanctions, US sanctions-induced lower propensity for US multinationals to engage in Russia, and subject to severe disruption of financial flows, including trade credits and insurance - has managed to substantially outperform our trade with other BRIC economies and expand by 20.8% y/y in terms of combined trade flows and 13.4% in terms of exports to Russia. The reason for this the longer-term nature of our exporters engagement in the Russian markets and more partnership-based approach to trade. Irish exports to Russia are strongly dominated by indigenous, smaller exporters who tend to secure longer-term relationship-based engagement in the market. In addition, Irish exports to Russia are strongly developed in the areas of food production and agri-food technologies - two sectors that saw growth in investment in Russia.

Wednesday, March 4, 2015

4/3/15: Composite Activity Indicators for BRIC & Russia: February


Having covered Manufacturing PMIs (http://trueeconomics.blogspot.ie/2015/03/2315-bric-manufacturing-pmi-february.html) for BRICs and Services PMIs (http://trueeconomics.blogspot.ie/2015/03/4315-bric-services-pmis-stronger-growth.html), let's take a look at the data for combined metrics of two sectors.

First, table below summarises the changes in Manufacturing and Services PMIs across all BRICs:


Markit - the source of both PMI data sets - also reports Composite PMI of their own. My data is based on same inputs but takes a more simple approach of combining the two data points for each country. This allows me to take each economy aggregate performance across the sectors and group these economies into BRIC group by weighing their combined PMIs score by each economy's relative position in the global economy.

Here are the results:

And for BRICs excluding Russia:


The above charts show two things:

  1. BRICs overall contribution to global growth is positive but weak, although it registered an improvement in February 2015 compared to January.
  2. Russia acts as a drag on global and BRICs growth. Major divergence between Russia and other BRICs started in January 2014, which, incidentally tells us that the talk about Russia not belonging to BRIC group on the basis of some structural or trend considerations is bonkers. Until January 2014, co-movement between BRICs ex-Russia and Russia is very strong and divergence from January 2014 on is clearly linked to geopolitical crisis and oil price collapse, rather than due to structural decoupling between BRICs ex-Russia and Russia.