Showing posts with label Volatility. Show all posts

Thursday, September 17, 2020

17/9/20: Exploding errors: COVID19 and VUCA world of economic growth forecasts


Just as I covered the latest changes in Eurozone growth indicators (https://trueeconomics.blogspot.com/2020/09/17920-eurocoin-leading-growth-indicator.html), it is worth noting the absolutely massive explosion in forecast errors triggered by the VUCA environment around COVID19 pandemic.

My past and current students know that I am a big fan of looking at risk analysis frameworks from the point of view of their incompleteness, as they exclude environments of deeper uncertainty, complexity and ambiguity in which we live in the real world. Well, here is a good illustration:


You can see an absolute explosion in the error term for growth forecasts vs actual outrun in the three quarters of 2020 so far. The errors are off-the-scale compared to what we witnessed in prior recessions/crises. 

This highlights the fact that during periods of elevated deeper uncertainty, any and all forecasting models run into the technical problem of risk (probabilities and impact assessments) not being representative of the true underlying environment with which we are forced to work.  


Wednesday, April 25, 2018

25/4/18: 90 years of Volatility: VIX & S&P


A great chart from Goldman Sachs via @Schuldensuehner showing extreme events in markets volatility using overlay of VIX and realised volatility from 1928 on through March 2018:


For all risk / implied risk metrics wonks, this is cool.

Saturday, July 29, 2017

28/7/17: Risk, Uncertainty and Markets


I have warned about the asymmetric relationship between markets volatility and leverage inherent in lower volatility targeting strategies, such as risk-parity, CTAs, etc for some years now, including in 2015 posting for GoldCore (here: http://www.goldcore.com/us/gold-blog/goldcore-quarterly-review-by-dr-constantin-gurdgiev/). And recently, JPMorgan research came out with a more dire warning:

This is apt and timely, especially because volatility (implied - VIX, realized - actual bi-directional or semi-var based) and uncertainty (implied metrics and tail events frequencies) have been traveling in the opposite direction  for some time.

Which means (1) increasing (trend) uncertainty is coinciding with decreasing implied risks perceptions in the markets.

Meanwhile, markets indices are co-trending with uncertainty:
Which means (2) increasing markets valuations are underpricing uncertainty, while focusing on decreasing risk perceptions.

In other words, both barrels of the proverbial gun are now loaded, when it comes to anyone exposed to leverage.

Thursday, July 20, 2017

20/7/17: U.S. Institutions: the Less Liberal, the More Trusted


In my recent working paper (see http://trueeconomics.blogspot.com/2017/06/27617-millennials-support-for-liberal.html) I presented some evidence of a glacial demographically-aligned shift in the Western (and U.S.) public views of liberal democratic values. Now, another small brick of evidence to add to the roster:
The latest public opinion poll in the U.S. suggests that out of four 'net positively-viewed' institutions of the society, American's prefer coercive and non-democratic (in terms of internal governance - hierarchical and command-based) institutions most: the U.S. Military and the FBI. as well as the U.S. Federal Reserve. Note: the four are U.S. military, the FBI and the Supreme Court and the Fed are all institutions that are not open to influence from external debates and are driven by command-enforcement systems of decision making and/or implementation. Whilst they serve democratic system of the U.S. institutions, they are  subject to severely restricted extent of liberal checks and balances.

Beyond this, considering net-disfavoured institutions, executive powers (less liberty-based) of the White House are less intensively disliked compared to more liberty-based Congress.

Tuesday, June 27, 2017

27/6/17: Millennials’ Support for Liberal Democracy is Failing


New paper is now available at SSRN: "Millennials’ Support for Liberal Democracy is Failing. An Investor Perspective" (June 27, 2017): https://papers.ssrn.com/sol3/papers.cfm?abstract_id=2993535.


Recent evidence shows a worrying trend of declining popular support for the traditional liberal democracy across a range of Western societies. This decline is more pronounced for the younger cohorts of voters. The prevalent theories in political science link this phenomena to a rise in volatility of political and electoral outcomes either induced by the challenges from outside (e.g. Russia and China) or as the result of the aftermath of the recent crises. These views miss a major point: the key drivers for the younger generations’ skepticism toward the liberal democratic values are domestic intergenerational political and socio-economic imbalances that engender the environment of deep (Knightian-like) uncertainty. This distinction – between volatility/risk framework and the deep uncertainty is non-trivial for two reasons: (1) policy and institutional responses to volatility/risk are inconsistent with those necessary to address rising deep uncertainty and may even exacerbate the negative fallout from the ongoing pressures on liberal democratic institutions; and (2) investors cannot rely on traditional risk management approaches to mitigate the effects of deep uncertainty. The risk/volatility framework view of the current political trends can result in amplification of the potential systemic shocks to the markets and to investors through both of these factors simultaneously. Despite touching on a much broader set of issues, this note concludes with a focus on investment strategy that can mitigate the rise of deep political uncertainty for investors.


Wednesday, June 7, 2017

7/6/17: Equity Markets Continue to Mis-price Policy Risks


There has been some moderation in the overall levels of Economic Policy Uncertainty, globally, over the course of May. The decline was primarily driven by European Uncertainty index falling toward longer-term average (see later post) and brings overall Global EPU Index in line with longer term trend (upward sloping):


This meant that short-term correlation between VIX and Global EPUI remained in positive territory for the second month in a row, breaking negative correlations trend established from October 2015 on.

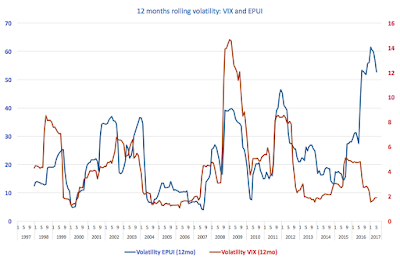
The trends in underlying volatility of both VIS and Global EPUI remained largely the same:


The key to the above data is that equity markets risk perceptions remain divorced from political risks and uncertainties reflected in the Global EPUI. This is even more apparent when we consider actual equity indices as done below:

Both, on longer-run trend comparative and on shorter term level analysis bases, both S&P 500 and NASDAQ Composite react in the exactly opposite direction to Global Economic Policy Uncertainty measure: rising uncertainty in the longer run is correlated with rising equities valuations.

Tuesday, March 14, 2017

13/3/17: Bitcoin v Gold: Volatilities and Correlation


On foot of the previous post, a reader asked me for some analysis of comparatives between Bitcoin volatility and Gold price volatility. It took some time to get to the answer. One of the reasons is that Bitcoin is traded continuously, while gold prices are listed for specific markets trading dates. So it takes some time to reconcile two data sets.

Here is the analysis. Starting with daily returns volatilities for log-log returns:


Several things are obvious from the above chart:

  1. Overall Bitcoin price volatility is magnitudes greater than volatility of gold prices almost always. Historical standard deviation in daily returns is 2.663% and Gold price (log daily returns) volatility is 0.466%, which means that historically, gold daily returns are less volatile than Bitcoin daily returns by a more than a factor of 5. 
  2. There are, broadly speaking three key periods of Bitcoin volatility: the period from September 2011 through December 2012, when volatility was extreme and declining, the period from January 2013 through February 2015, when volatility in Bitcoin was characterised by severe spikes and elevated base, and the period from March 2015 on, when both the spikes in volatility and the base of volatility abated. These three periods are associated with the following comparatives between gold volatility and Bitcoin volatility: period through December 2012: gold daily returns volatility 0.520% against Bitcoin daily returns volatility of almost 6 times that at 3.00%; period from January 2013 through February 2015, when Bitcoin returns volatility (3.27%) was almost 7.5 times gold returns volatility (0.479%), and the current period from March 2015, where Bitcoin daily returns volatility (1.421%) was over 3 times daily returns volatility for gold (0.412%). Note: these are log-log returns, so much of extreme volatility is smoothed out and this benefits the Bitcoin.
  3. There is a long-term trend difference between gold returns volatility and Bitcoin returns volatility, as shown by polynomial (power 6) trend lines for both. In fact, even in terms of trend, Bitcoin is much more volatile than gold and Bitcoin's volatility is less stable than volatility of gold. 
In very simple terms, Bitcoin volatility is vastly in excess of Gold's volatility, albeit the former is starting to moderate in more recent years.

Now, for the last bit of observations. I also mentioned that Bitcoin is distinct from Gold in terms of its financial properties. And guess what, I did not provide any evidence. Well, here it is. Bitcoin returns and Gold returns are not correlated, or in other words, they neither co-move with each other nor countermove against each other. Here's a chart to prove this:


Average 30-days running correlation for Bitcoin and gold in terms of daily log-log returns is 0.03025 historically, which is statistically indifferent from zero. Across the three periods of Bitcoin volatility structure (defined above), average correlation between Bitcoin and gold log-log returns was 0.0147, 0.0182 and 0.0529 respectively. All of these are statistically indifferent from zero. In history of the Bitcoin, there were only 7 occasions on which daily returns were correlated positively with gold price with correlation in excess of 0.5. and 5 with negative correlation in excess of -0.5 in absolute value None with correlation in excess of 0.65 in absolute value for either positive or negative correlations. 

Bitcoin comparatives to gold hold about as much water as a colander hit by a shrapnel shot.

Sunday, March 12, 2017

12/3/17: Bitcoin Pop: Nothing too Dramatic by Historical Comparatives


Few days back, I posted a quick note about the erroneous nature of Bitcoin-Gold comparatives. And yesterday, we had one of those events that highlights the same.

In summary of the event, SEC rejected an application for a Bitcoin ETF.  And Bitcoin crashed. Inter-day volatility shot up through the roof. Which would have been bad enough, except it is the norm for Bitcoin


You can see just how unsurprising the current volatility is for the BTC, consider the following charts:


Pretty much by every metric of volatility, Bitcoin's latests wobble is minor, despite it being dramatic enough to set @Reuters and @Bloomberg folks all hopping with excitement. Thing is, folks, Bitcoin's volatility is in the league of financial widow-makers.

Sunday, January 10, 2016

10/1/16: Crisis Contagion from Advanced Economies into BRIC


New paper available: Gurdgiev, Constantin and Trueick, Barry, Crisis Contagion from Advanced Economies into Bric: Not as Simple as in the Old Days (January 10, 2016). 

Forthcoming as Chapter 11 in Lessons from the Great Recession: At the Crossroads of Sustainability and Recovery, edited by Constantin Gurdgiev, Liam Leonard & Alejandra Maria Gonzalez-Perez, Emerald, ASEJ, vol 18; ISBN: 978-1-78560-743-1. Link: http://papers.ssrn.com/sol3/papers.cfm?abstract_id=2713335.


Abstract:      

At the onset of the Global Financial Crisis in 2007-2008, majority of the analysts and policymakers have anticipated contagion from the markets volatility in the advanced economies (AEs) to the emerging markets (EMs). This chapter examines the volatility spillovers from the AEs’ equity markets (Japan, the U.S and Europe) to four key EMs, the BRIC (Brazil, Russia, India and China). The period under study, from 2000 through mid-2014, reflects a time of varying regimes in markets volatility, including the periods of dot.com bubble, the Global Financial Crisis and the European Sovereign Debt Crisis, the Great Recession and the start of the Russian-Ukrainian crisis. To estimate volatility cross-linkages between the advanced economies and BRIC, we use multivariate GARCH BEKK model across a number of specifications. We find that, the developed economies weighted return volatility did have a significant impact on volatility across all four of the BRIC economies returns. However, contrary to the consensus view, there was no evidence of volatility spillover from the individual AEs onto BRIC economies with the exception of a spillover from Europe to Brazil. The implied forward-looking expectations for markets volatility had a strong and significant spillover effect onto Brazil, Russia and China, and a weaker effect on India. The evidence on volatility spillovers from the advanced economies markets to emerging markets puts into question the traditional view of financial and economic systems sustainability in the presence of higher orders of integration of the global monetary and financial systems. Overall, data suggests that we are witnessing less than perfect integration between BRIC economies and advanced economies markets to-date.

Thursday, March 7, 2013

7/3/2013: Are stocks more volatile in the long run?

A recent paper by Lubos Pastor and Robert F. Stambaugh, titled Are Stocks Really Less Volatile in the Long Run? (first published NBER Working Paper Series No. 14757; Cambridge: National Bureau of Economic Research, 2009.) and subsequently in the Journal of Finance (vol 67, number 2, April 2012, pages 431-477) looks at the annualized returns volatility to stocks returns - the central concern for investors and finance practitioners. 

The study uses predictive variance approach to the analysis of volatility and look at what happens to predictive variance as the investment horizon increases. Conditional variance is variance in returns conditioned on the set of information known to investors.The predictive variance is therefore the conditional variance, where conditioning information is taken at the time when investors make their assessment of the risks (volatility) and returns implied by an instrument. 


Now, it is commonly established that stock returns volatility per any given period falls over the longer periods, potentially due to mean reversion, as majority of the studies show or argue. But this only relates to volatility as measured concurrently - in other words unconditionally. Of course, investors face volatility as expected on the basis of conditioning variables, and this predictive variance, it turns out, actually is higher, not lower, over the long periods. The study shows that this reversal of the relationship between investment duration and volatility of returns holds even once we control for mean reversion. In other words, uncertainty about future expected returns is a core driver of higher long-horizon variance in stocks.

Sunday, January 1, 2012

1/1/2012: Groundhog Year 2012 - part 1

In the tradition of looking back at the year passed, let's take a quick view of one of my favorite indicators for risk assets fundamentals: the VIX index.

CBOE Volatility Index finished the year well off the inter-year highs, but nonetheless in an unpleasant territory. VIX closed December 2011 at an elevated 23.40, ahead of December 2010 close of 17.75, 2009 close of 21.68 and only behind the December 2008 levels of 40.00. December 2007 close was 22.50 and December 2006 was 11.56.

More unpleasant arithmetic emerges when we consider inter-annual performance. Historical maximum for daily close (from January 1990 through present) is 80.86, while maximum for 2010-present was 48.00 set on August 8, 2011.

The historical average for VIX is 20.57, while the average for January 2008-present is 27.74, for January 2010-present is 23.38 and for 2011 as a whole - 24.20, implying that wile 2011 was not the worst performing year on the record, it was certainly worse than 2010. Table below summarizes annual data comparatives.

Average intra-day volatility actually marks 2011 as the worst year on record. Average intra-day spread for VIX stands at 9.28 in 2011 against 8.97 in 2010-present and 9.08 in 2008-present. And both 3mo and 1mo dynamic standard deviations posted poor performance for VIX in 2011, making it the worst year on the record other than 2009. VIX dynamic 1mo semi-variance closed the year on 7.80 and annual average of 4.26 against 2010 average of 3.96 and 2009 average of 5.78.

Charts below highlight the fact that 2011 was a poor year for fundamentals-based analytics:


All above suggest that volatility is the starting point for 2012. Welcome back to the New 'Groundhog Day' Year.

Friday, September 9, 2011

09/09/2011: VIX - another blow out

EU debt disaster and US own woes or just EU debt disaster, who knows, but VIX - that indicator of overall risk perceptions in the markets - is again above the psychologically important 40 mark.

Charts to illustrate:
Vix has gone to close at 40.50 today having opened at 35.53 and hitting the high of 40.74. In terms of historical comparatives:
  • Intra-day high achieved today was 170th highest point reached by VIX since Jan 1, 1990, 147th highest reading since Jan 1, 2008 and 15th highest since Jan 1, 2010
  • VIX closing level was 156th highest in history since Jan 1, 1990, 129th highest since Jan 1, 2008 and 8th highest since Jan 1, 2010. The latter being pretty impactful
Intra-day spread was pretty high, but not too remarkable, ranking as 179th highest since Jan 1, 1990, 102nd highest since Jan 1, 2008 and 49th highest since Jan 1, 2010, suggesting possible structural nature of elevated readings in VIX overall.
3 mo dynamic standard deviation of VIX index reached 8.981 - the highest level of volatility in VIX since January 1, 2010 and 90th highest since both Jan 1, 2008 and Jan 1, 1990. We are now clocking the highest level of VIX volatility (on 3mo dynamic basis) since February 2009.

Looking at semi-variance:
1mo dynamic semi-variance for VIX is now running at 15.73 - not dramatic, but showing persistently elevated trend since August 5, 2011. Today's reading was, nonetheless, only 27th highest since Jan 1, 2010. To flag that - below is the snapshot of short series range:Yep, folks, with VIX stuck at elevated levels with occasional blowouts like today, with European banks beefing up their deposits with ECB and Bank of Japan, with investors throwing money at Uncle Sam and Bundesbank (at negative interest rates) and demand for CHF undeterred by the threats of continued devaluations, what we are seeing is fundamentals-driven run for safety. Nothing irrational here, unless feeling sh***less scared is irrational...

Monday, August 17, 2009

Economics 17/08/2009: US markets jitters

US Markets: I've told you to be weary of the return of volatility. Chart below shows today's sudden- 17% jump in VIX volatility index and the coincident fall-off in the main markets (sorry, crumbling Eircom broadband infrastructure means I can't get my hand on better charts right now):

Even more worrisome is the following chart, showing that both near-term VIX and long-term VIX are actually in excess of the current VIX, so markets are now pricing higher volatility for the foreseeable future.
Another telling graph above - notice negative correlation of the last few months turning positive about a week ago and back to negative now - this is a likely holding pattern as in 2007 late Summer and 2008 Summer-Fall.

China was the latest trigger today, but it all goes back to trade flow, as China is a barometer of this and trade flows are a barometer of global growth...

Thursday, January 1, 2009

Volatility falling?

In a rare piece of good news VIX index measuring (albeit imperfectly) revealed risk assessments in the US markets, has fallen below 40 on the final trading day of the year, for the first time since October 1. The VIX is the Chicago Board Options Exchange Volatility Index shows the market's expectations for volatility over a 30-day period.

As my students in Investment Theory course would know, only human imagination is a limit to the number of ways one can think about (and depict) market volatility. Here are three simple (my favourite criteria for empirical validity) ways of doing this.

Chart 1 plots VIX data since January 1990. This shows a dramatic fall in VIX reading since November highs. But, it also shows the cyclicality of VIX – an approximate 3:5:3 cycle of 3 years rising volatility trend, followed by 4-5 years of elevated ‘flat’ trend, concluding with a 3 years of falling trend. By this pattern, we are not out of the woods. Indeed, we have just finished the 3-year rising trend bit around mid 2008, implying that a long-term elevated volatility period may be still ahead for us.
Chart 2 plots intra-day variation in VIX (High-to-Close, alongside the same logic as semi-variance models of risk pricing). Note the unusually elevated red peaks since ca July 2007. This disputes the common claim that it took some time for credit markets troubles (starting in mid-Summer 2007) to feed through into the markets for real claims (assets with fundamental underpinnings). Once again, the latest moderation in VIX reading may be simply concealing the historically high volatilities in risk perceptions that drive daily markets.

Chart 3 shows three alternative, albeit slightly similar, measures of risk dynamics. Note that up until around mid February 2007, daily deviations in VIX readings measured as ‘High’-to-‘Low’ and ‘High-to-Close’ tracked one another and were roughly in line with the weekly Moving Average in the standard deviation. In other words, while risk itself might have been rising or falling over time, the uncertainty about the future risk levels was much lower and more static prior to the beginning of 2007.
This ‘calm’ was first challenged in February and then finally shattered in late September 2007. Once again, no matter how positive the latest decline in VIX to below 40 may sound, we are not of the woods yet.

Expect:
• More intra-day and intra-week volatility, and
• Less predictability in volatility trend.
2009 seas of financial market are going to be no less choppy than the ‘Perfect Storm’-torn 2008.