Showing posts with label Services. Show all posts

Wednesday, January 6, 2021

6/1/21: BRIC: Composite Economic Indicators: 4Q 2020

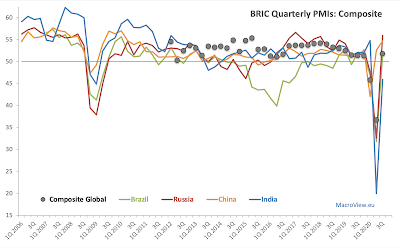
Now, Composite PMIs:
  • Brazil Composite PMI rose from 51.6 in 3Q 2020 to 54.4 in 4Q 2020, marking second consecutive quarter of > 50.0 readings. Average 4 quarters PMI stands at 46.2, suggesting that Brazil's economy has not, yet, recovered fully from the Covid19 pandemic impact. Nonetheless, statistically, both 3Q and 4Q readings are signaling economic expansion and 4Q growth in Brazil's economy appears to be faster-paced than global (global composite PMI was at 53.3 in 4Q 2020).
  • Russia Composite PMI is in a contraction territory, with 4Q 2020 reading of 47.7, down from 55.9 in 3Q 2020. Over the course of 2020, Russia Composite PMI averaged 46.0, the second weakest in the BRICs group. At 47.7, 4Q 2020 PMI is exactly in line with 1Q 2020 PMI.
  • India Composite PMI rose from 45.9 in 3Q 2020 to 56.4 in 4Q 2020, signaling rapid bounce back in the economy, that, nonetheless continues to suffer from the pandemic-induced economic crisis. Full year 2020, Composite PMI average is at 44.3, by a distance, the lowest in the BRICs group. 
  • China Composite PMI rose from 54.7 in 3Q 2020 to 56.3 in 4Q 2020, marking third consecutive quarter of economic growth, with full year PMI averaging 51.4, suggesting that the Chinese economy has now recovered fully from the Covid19 pandemic impact. 

Overall, three out of four BRIC economies posted 4Q 2020 Composite PMI above Global Composite PMI: Brazil, India and China, with Russia being the only BRIC economy posting both sub-Global and sub-50 Composite PMI reading at the end of 2020. Only one BRIC economy has, so far, signaled full recovery from the Covid19 crisis shock: China, with all other BRICs still recovering from the pandemic.

Given that both BRIC Manufacturing Sector Activity Index (54.9 in 4Q 2020) and BRIC Services Sector Activity Index (54.8 in 4Q 2020) are above Global Manufacturing (53.5) and Services (52.3) PMIs, BRIC economies as a group have supported global economic growth to the upside in 4Q 2020. In contrast, BRIC Manufacturing Activity Index outperformed Global Manufacturing PMI in 3Q 2020 (53.0 to 51.6), while BRIC Services Activity Index (51.0) underperformed Global Services PMI (51.4). 

6/1/21: BRIC: Services PMIs: 4Q 2020


BRIC's manufacturing PMIs for 4Q 2020 were covered here: https://trueeconomics.blogspot.com/2021/01/4121-bric-manufacturing-pmis-4q-2020.html. Now, to Services PMIs:

  • Brazil Services PMI rose from 47.5 in 3Q 2020 to 51.4 in 4Q 2020, with aggregate 2020 levels of activity still significantly below 2019 levels. At 51.4, the index is barely statistically above 50.0 (95% confidence bound is 51.3). However, the latest quarterly reading is the first nominally above 50.0 after three consecutive quarters of sub-50 readings. 
  • Russia Services PMI crashed in 4Q 2020 from 56.8 in 3Q to 47.7. Statistically, Russian services sector is contracting and it is contracting rapidly. In the entire 2020, there were three quarters of deeply sub-50 readings against one quarter of above 50.0 expansion. Services sector reading is basically identical to 47.6 recorded in Manufacturing sector, which means that in 4Q 2020 there was no 'comfort zone' in the Russian economy in terms of growth.
  • India Services PMI rose significantly in 4Q 2020 compared to 3Q 2020, from 41.9 to 53.4.  However, this growth is unlikely to bring India's services activity anywhere near pre-Covid19 levels. 
  • China Services PMI rose for the third consecutive quarter in 4Q 2020. In 2Q 2020, China's Services PMI was at 52.6, which increased to 54.3 in 3Q 2020 and to 57.0 in 4Q 2020. Nonetheless, it is still doubtful that Chinese services activities have fully recovered from the pandemic as of the end of 2020.
  • Overall, BRIC Services Activity Index based on PMIs and respective GDP shares in the global economy rose for the second quarter in a row from 51.0 in 3Q 2020 to 54.8 in 4Q 2020. This marks some recovery from the Covid19 pandemic impact, although this recovery remains incomplete. BRICs have - as a group - outperformed Global Services PMI which rose from 51.4 in 3Q 2020 to 52.3 in 4Q 2020.

Saturday, November 7, 2020

7/11/20: BRIC: Composite Economic Indicators for October

 I covered BRIC Manufacturing and Services PMIs for October in two earlier posts (see here https://trueeconomics.blogspot.com/2020/11/51120-bric-services-pmis-october.html), so now, Composite PMIs:


  • Brazil Composite PMI rose to 55.9 in October, compared to 51.6 in 3Q 2020, and currently sits above Global Composite PMI of 53.3. The latest increase in PMI is a robust signal of partial recovery, marking the third consecutive month of > 50.0 readings that followed five consecutive months of contraction. 
  • Russia Composite PMI was the weakest of all BRIC PMIs, falling to 47.1 in October, compared to 55.9 in 3Q 2020, and marking the first sub-50 reading in four months.
  • India Composite PMI was the strongest amongst the BRIC PMIs rising to 58.0 in October against 45.9 in 3Q 2020. Overall, Indian economy is only starting to inch out of the recession that was marked by two consecutive quarters of sharply contractionary PMIs.
  • China Composite PMI posted an increase to 55.7 in October relative to 54.7 in 3Q 2020, marking the start of the third quarter of growth. Overall, the latest reading indicates that Chinese economy has completed its recovery from 1Q 2020 recession.
Overall, BRIC Manufacturing indicator (55.2 in October, compared to 53.0 in 3Q 2020) and Services indicator (54.9 in October, compared to 51.0 in 3Q 2020) have posted better performance than their Global counterparts (53.0 and 52.9, respectively for October). BRIC Manufacturing indicator is now outperforming Global Manufacturing PMI in 8th consecutive quarters, and BRIC Services indicators is running above Global Services PMI for the first time after posting poorer performance in 3Q 2020.

Thursday, November 5, 2020

5/11/20: BRIC: Services PMIs October

In the earlier post, I covered BRIC economies manufacturing PMIs for October: https://trueeconomics.blogspot.com/2020/11/31120-bric-manufacturing-pmis-october.html. Now, leet's take a look at Services PMI.


As the chart above illustrates:
  • Brazil Services PMI rose from 47.5 in 3Q 2020 to 52.3 in October. Prior to October, Brazil's services sector was in a contractionary territory for three consecutive quarters. October marks the second month of above 50.0 readings, although statistically-speaking, September reading was indistinguishable from 50.0 stagnation / zero growth level.
  • Russian Services PMI posted a sharp contraction, falling from 56.8 in 3Q 2020 to 46.9 in October. Russia enjoyed just three months of > 50.0 readings in July-September 2020, implying that the economy is nowhere near a V-shaped recovery from the pandemic and that things are getting worse, not better in the services sectors. Even worse dynamics apply to Manufacturing where Russia has not seen sustained > 50 readings since March 2019.
  • India Services PMI rose to 54.1 in October, marking the first month of above 50.0 readings since February 2020. Given cumulative nature of the PMIs, October rebound is nowhere near being sizeable enough to start closing the pandemic-induced drop-off in economic activity. India's services have now posted seven months of contraction in 2020, compared to four months for Manufacturing. October marks the first month since February with both indices above 50.0.
  • Chinese Services PMI rose to 56.8 in October, compared to 54.8 in September, marking 6th consecutive month of both Manufacturing and Services PMIs above 50.0 line. 
Overall, BRIC Services Activity Index (a measure of Services sectors activity calculated by me based on monthly Markit PMI data and country-specific share of the world GDP, PPP-adjusted) rose to 54.9 in October compared to 51.0 in 3Q 2020, marking a second month of > 50.0 readings and accelerating growth momentum. October BRIC reading is in excess of the Global Services PMI reading of 52.9, implying that as a group, BRIC economies are contributing positively to global economic growth momentum, although both Brazil and Russia are pushing BRIC reading down, compared to Global Services PMI.

Wednesday, October 14, 2020

14/10/20: BRIC: Composite economic activity indicators Q3 results


We covered in detail strong recovery in BRIC Manufacturing PMIs (https://trueeconomics.blogspot.com/2020/10/141020-bric-manufacturing-pmis-q3.html) and fragile recovery in Services PMIs (https://trueeconomics.blogspot.com/2020/10/141020-bric-services-pmis-q3-results.html). Here is a summary chart:


Now, let's take a look at BRIC Composite PMIs for 3Q 2020:

Brazil Composite PMI ended Q3 2020 on a reading of 51.6 - an improvement on 31.8 in 2Q 2020. Brazil's Composite PMIs have run sub-50 recessionary reading in 1Q and 2Q 2020, returning to growth in 3Q 2020, albeit at the levels not consistent with a V-shaped recovery.

Russia Composite PMI stood at a strong 55.9 reading in 3Q 2020, up on 32.6 in 2Q 2020 and signaling an end to 2 consecutive quarters of sub-50 readings. This marks the fastest pace of growth since 1Q 2017, but is also consistent with the levels of current activity being still below pre-COVID19 pandemic period. 

India Composite PMI remained in recessionary territory in 3Q 2020 at 45.9, an improvement on 19.9 in 2Q 2020. Overall, Indian economy has suffered the sharpest hit from the pandemic, compared to all other BRICs. It is continuing to exhibit recessionary dynamics to-date. 

China Composite PMI ended 3Q 2020 at 54.7, marking the second consecutive quarter of recover (2Q 2020 reading was 52.6). 3Q 2020 reading is the highest since 1Q 2020, and suggests that the Chinese economy is getting close to recovery in its activity levels to pre-pandemic position. 

Overall, BRIC block activity indices imply lagging momentum in the recovery in services, and faster than global pace of recovery in manufacturing. Statistically, BRIC growth momentum in 3Q 2020 is within historical average, however, growth dynamics in 1Q and 2Q 2020 were significantly below historical averages, which implies that 3Q 2020 PMIs indicate incomplete or only partial recovery in the BRIC economies post-pandemic so far.


14/10/20: BRIC: Services PMIs Q3 results


BRIC Manufacturing has rebounded strongly from thee pandemic lows, as covered in this post here: https://trueeconomics.blogspot.com/2020/10/141020-bric-manufacturing-pmis-q3.html. Services PMI for the BRIC economies signal similar, albeit weaker rebound in July-September:


Brazil Services PMI stayed in the recession territory in 3Q 2020, with index reading coming in at 47.5, up on 30.3 in 2Q 2020, but still marking a third consecutive quarter of sub-50 readings. Put simply, unlike manufacturing that is showing rather incredible signs of the recovery, Brazil's services sectors continue to show ongoing contraction, building on 6 consecutive months of contracting activity through August 2020. September monthly reading at 50.4 is statistically indistinguishable from zero growth line of 50.0. In summary, Brazil's services sector is not in a recovery so far.

Russia Services PMI posted very strong recovery signals in 3Q 2020, although September reading slipped to 53.7 (fast growth) from blistering 58.5 and 58.2 in July and August, respectively. 3Q 2020 Russia Services PMI was at 56.8 marking a sharp turnaround from 36.0 in 2Q 2020. This is the fastest pace of quarterly expansion since 1Q 2017.

India Services PMI remains in contraction, with 3Q 2020 reading of 41.9, an improvement on sharper rates of deterioration in 2Q 2020 at 17.2. September marked seventh consecutive month of sub-50 readings in Services sector in India.

China Services PMI came in at 54.3 in 3Q 2020, up on 52.6 in 2Q 2020, marking second consecutive quarter of recovery from the pandemic lows of 1Q 2020 when the index fell to 40.4. 

Overall, BRIC Services Activity Index - an index compiled by me based on GDP shares and Markit monthly PMI data - rose from 40.4 in 2Q 2020 to 51.0 in 3Q 2020. Given the nature of PMIs as signals of monthly changes in activity, 3Q 2020 reading is consistent with the BRIC block services sectors recovering only partially from the pandemic lows. BRIC Services Activity Index ended 3Q 2020 at the levels slightly below the Global Services PMI which stood at 51.4. Global services sectors are also showing more rapid rate of quarterly recovery, rising from 35.6 in 2Q 2020 to 51.4 in 3Q 2020.


Thursday, September 10, 2020

8/92020: BRIC: Composite economic activity indicators

 Based on Markit's Composite PMIs, here are the BRIC economies composite economic activity indicators for 3Q 2020 to-date (July-August). 

Please, note: Manufacturing PMIs for BRIC economies were covered here: https://trueeconomics.blogspot.com/2020/09/8920-bric-manufacturing-pmis.html, and Services PMIs were covered here: https://trueeconomics.blogspot.com/2020/09/8920-bric-services-pmis.html


  • Brazil Composite PMI for 3Q 2020 currently sits at 50.6, barely above the zero-growth line of 50.0 in statistical terms. This represents a major improvement in growth momentum compared to an outright depressionary reading of 31.8 in 2Q 2020 and a swing of 18.8 points - a respectable reversal of momentum, although not a signal of an appreciable recovery from the recession.
  • Russia Composite PMI for 3Q 2020 is at blistering 57.1, suggesting a genuine recovery, albeit one-sided, driven by services sector rebound. COVID19 pandemic low was recorded in 2Q 2020 at abysmal 32.6, implying latest swing from the trough of massive 24.5 points. This does appear to be consistent with a robust recovery momentum, albeit with some caveats. This is the highest reading for any quarter since 3Q 2006 and the third highest reading on record.
  • China Composite PMI is at 54.8 so far through 3Q 2020, an improvement on growth-signalling 52.6 reading in 2Q 2020 and up respectable 12.8 points on recession trough in 1Q 2020.
  • India Composite PMI managed to rocket to a still-recessionary 41.6 in 3Q 2020 to-date, up on the recession trough of 19.9 in 2Q 2020 - a swing of 21.7 points. Still, the economy remains in a pronounced recession and 3Q 2020 so far is showing signs of exacerbated contraction building on 2Q 2020 collapse in activity.
For BRIC economies as a whole, the chart next shows GDP-weighted and GDP-shares weighted BRIC Indices of activity, compared to Global Composite PMIs:


Overall, BRIC economies growth momentum is still subdued and largely performing worse than the Global Composite PMI indicator.

8/9/20: BRIC: Services PMIs

Services sector activity as reflected by PMIs from the BRIC economies is now available for August, so here are the top numbers: 

In terms of actual readings, and do recall, quarterly PMIs referenced above are averages over three months period, so 3Q 2020 data is only covering July-August 2020.
  • Brazil Services PMI was nowhere near the insane reading posted by the country Manufacturing PMI (see post here: https://trueeconomics.blogspot.com/2020/09/8920-bric-manufacturing-pmis.html). Services index came in at 46.0 for the period of July-August (3Q 2020 to-date), up on disastrously low 30.3 in 2Q 2020, but still well below 50.0 line of zero growth. Reading PMIs, this means that the sector activity continued to contract in 3Q 2020 so far, on top of the already sharp contraction experienced in 1Q 2020 and 2Q 2020.
  • Having set no records in Manufacturing, Russia Services PMI came out with a massive and seriously surprising print to the upside in August. As the result, 3Q 2020 to-date Services PMI rose to 58.4 for the highest reading since 2Q 2009. As massive as the print is, it is pretty 'normal' for volatile Russian services data. Still, the recovery it signals is sharp, as 2Q 2020 COVID19 trough was at a misery-inducing 32.0. The implied trough-to-peak swing is jaw-dropping 26.4 points.
  • China Services PMI rose in the first two months of 3Q 2020 to 54.1 from already expansionary 52.6 in 2Q 2020. Trough-to-peak COVID19 swing is now at 13.7 points, and the latest reading is the highest since 4Q 2010, when the index stood at 54.2.
  • India Services sectors are still in sharp contraction. Recall: in 2Q 2020, India Services PMI crashed, smashed, collapsed, melted down, or whatever else you might call, falling from 54.1 in 1Q 2020 to 17.2 in 2Q 2020, the lowest reading for any BRIC economy in any sector at any time. So far, in 3Q 2020, the index is running at 38.0, which implies that India's services sectors continue to contract from already reduced activity in prior quarter. In the light of this super-sharp recessionary dynamic, it is impossible to reconcile Manufacturing sector PMI and Services sector PMI in this economy.

Overall, BRIC Services Activity Index - a measure I compute using a range of data inputs, including Markit's PMIs - came in 49.9 in 3Q 2020 (to-date), an improvement on 2Q 2020 reading of 40.4 and above 1Q reading of 44.9. Nonetheless, across the four largest EM economies, Services activity continues to contract for the third quarter in a row, nominally, and it is standing still statistically. In this, BRIC economies are distinct from the Global Services PMI indicator, which rose from 35.6 in 2Q 2020 to 51.3 in 3Q 2020 (to-date). 


Stay tuned for BRIC Composite PMIs next.

Tuesday, July 7, 2020

6/7/2020: Irish Services Sector Activity Index: May 2020


COVID19 impact on services sectors activity in Ireland, data through May 2020:


Huge adverse impact on the economy. Note precautionary purchasing effect on Retail sales in the difference between Wholesale & Retail index and Wholesale sub-index. And some recovery in May, compared to 1Q 2020. But overall, conditions are still dire. And we are not yet seeing the effects of consumer behavior changes on post-restrictions demand. That is still coming...

Forward industry view (ex-behavioral aspects) for June 2020, via Purchasing Managers Index:


Thursday, December 11, 2014

11/12/2014: QNA Q3 2014: Sectoral Activity


Here is the first post on QNA detailed analysis, covering sectoral distribution of activity in Q3 2014.

Note: I covered top level results here: http://trueeconomics.blogspot.ie/2014/12/11122014-q3-2014-irish-growth-broadly.html

Based on seasonally unadjusted data expressed in constant prices (real terms).

Overall all sectors output amounted to EUR40.868 billion in Q3 2014 which is 3.44% higher than in Q3 2013. This marks a significant slowdown on Q2 2014 growth that clocked at 6.53% y/y, but is marginally above Q1 2014 y/y growth at 3.23%.

For the first nine months of 2014, output of all sectors is up 4.41% compared to the same period in 2013. A very healthy number, albeit moderated by the following factors:

  1. ESA2010 application is boosting (superficially) business activity relating to R&D allocations, now counted as investment; 
  2. Ongoing shift in MNCs patterns of activity here, including (but not limited to) outsourcing of production; and
  3. Ongoing shift of the externally trading economy in favour of ICT services, heavily reliant on profit shifting and tax optimisation.


Agriculture, Forestry & Fishing sector output stood at EUR989 million in Q3 2014, which is down 1.59% y/y - the worst performance since Q2 2013. In Q2 2014 y/y growth in the sector was massive 12.43% and in in Q1 2014 it was 3.74%. Over the first nine months of 2014, activity in the sector expanded 5.47% y/y.

Industry, including Construction, output stood at EUR10.281 billion in Q3 2014, which is up 1.96% y/y - a slowdown on Q2 2014 growth rate of 6.47% but an improvement on Q1 2014 decline of 4.97%. Over the first nine months of 2014, activity in the sector expanded only 1.11% y/y, which is weak. Meanwhile, Building & Construction sub-sector output stood at EUR895 million in Q3 2014, which is up 7.31% y/y - a slowdown on Q2 2014 growth rate of 9.54% and on Q1 2014 growth of 9.73%. Q3 2014 growth is the weakest since Q1 2013. Over the first nine months of 2014, activity in the sector expanded 8.76% y/y, which is ok-ish, given abysmally low levels of overall activity. Current level of activity is comparable to Q1-Q3 1997.

Distribution, Transport, Software & Communications output stood at EUR10.832 billion in Q3 2014, which is up 6.39% y/y - a healthy reading. Nonetheless, Q3 growth represents a slowdown on Q2 2014 growth rate of 11.46% and on Q1 2014 growth of 10.67%. Over the first nine months of 2014, activity in the sector expanded by a hefty 9.4% y/y, which is a good news.

Public Administration and Defence output stood at EUR1.572 billion in Q3 2014, which is down 1.26% y/y, against Q2 2014 growth rate of 3.75% and on Q1 2014 growth of 3.67%. Over the first nine months of 2014, activity in the sector expanded by 2.02% y/y in real terms.

Other Services (including rents) output stood at EUR17.622 billion in Q3 2014, which is up 3.67% y/y, against Q2 2014 growth rate of 2.69% and on Q1 2014 growth of 3.85%. So this sector showed acceleration in y/y growth rates. Over the first nine months of 2014, activity in the sector expanded by 3.48% y/y in real terms.

Summary of changes y/y is shown below in the table.


In summary: only one sector of the economy posted higher rates of growth in Q3 2014 compared to Q2 2014. Two sectors of the economy posted declines in activity y/y against four sectors that posted increased activity. This contrasts with all sectors posting growth in Q2.

Stay tuned for further analysis of QNA figures later tonight.

Friday, October 3, 2014

3/10/2014: Services PMI for Ireland: September 2014


Markit/Investec released their Services PMI for Ireland today. I covered Manufacturing PMI release here: http://trueeconomics.blogspot.ie/2014/10/1102014-irish-manufacturing-pmi.html

On Services side:

  • MNCs-driven activity in the sector expanded once again, with PMI for September rising to 62.5 from 62.4 in August and almost matching 62.6 reading in June.
  • 12mo MA is now at 60.9 - which is simply unbelievable, given the overall economy performance over the last 12 months. Predictably, of course, there is somewhat little connection between the survey - weighted heavily on MNCs side, such as ICT Services giants we house in Ireland - and the real economy.
  • 3mo average (Q3 2014 average) is at 62.1 which is identical to Q2 2014 average and is ahead of Q3 2013 average of 58.7. In other words, judging by the figures coming out of PMIs, Irish services economy is growing roughly at 7-8 percent per annum. Good luck spotting that on the ground.

Still, the above chart clearly shows that whether connected to real lives or not, Services economy is now averaging growth rates (post-crisis) that are above those recorded in pre-crisis period. This suggests two things:
  1. There has been a significant switch in economic activity in favour of services (dominated by the dynamics in ICT Services); and
  2. There has been a larger gap opening up between the real economy and tax optimisation-based economy.
I will blog on composite performance on quarterly basis, pooling together both Manufacturing and Services PMIs next, so stay tuned.

Wednesday, September 3, 2014

3/9/2014: Services PMI for Ireland: August 2014


Services PMI for Ireland are out today, so here is the update on combined PMIs. You can read my analysis of the Manufacturing PMIs here: http://trueeconomics.blogspot.ie/2014/09/192014-irish-manufacturing-pmi-august.html

Services sector in Ireland posted another month of high level growth in activity in August.

  • August PMI for Services sectors (Markit and Investec) rose to 62.4 from 61.3 in July and up on 61.6 in August 2013. 
  • This marks 6th consecutive month of readings above 60 (which signify rapid growth), and 25th consecutive month of readings above 50 (which signify growth).
  • 3mo average through May 2014 was 61.4 and 3mo average through August is at 62.1, showing continued trend support above 60-61 mark.

Chart below illustrates both series - Manufacturing and Services:


The above shows that both Manufacturing and Services sectors are now running at the levels well above their post-crisis period average.

Chart below shows the growth estimates consistent with averages:


The above shows some good news: current trend is above already robust long-term growth estimate.

The chart below combines both PMIs and shows that the two sectors together now fully supporting growth in the economy - which is a good news and a significant gain on 2013 and 2012.


So overall, strong news from the PMIs.