Showing posts with label #India. Show all posts

Sunday, June 6, 2021

6/6/21: BRIC PMIs for May: Volatile Growth and Surging Inflationary Pressures


BRIC PMIs for May 2021 show uneven pace of recovery within the group of the largest Merging and Middle Income economies and a uniform evidence of pressure on inflation side.

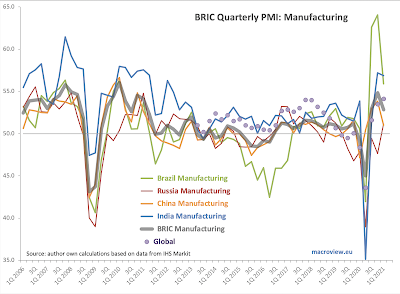
  • Brazil: Manufacturing PMI is currently running at 53.0 for 2Q 2021 for two months into the quarter, down from 1Q 2021 reading of 55.9. This marks second consecutive quarter of decreases in Manufacturing sector activity in Brazil. Brazil Services PMI is currently running at a deeper recessionary reading of 45.6, compared to 1Q 2021 at 46.1. As the result, Brazil's Composite PMI fell from the already recessionary reading of 47.9 in 1Q 2021 to 46.9 in 2Q 2021 to-date. Prices, meanwhile continued to show severe inflation pressures. Per Markit: "The rate of input cost inflation across the private sector softened further from March's record high, but remained one of the strongest since composite data became available in early-2007. ... In contrast to the trend for input costs, there was a quicker increase in aggregate selling prices. In fact, the rate of charge inflation was the strongest seen in the series history. Manufacturers again saw the sharper rise, despite inflation here softening during May."
  • Russia: Manufacturing PMI remains at the same level through the first two months of 2Q 2021 (51.2) as in 1Q 2021, implying steady, but relatively weak growth. That said, monthly numbers have been more volatile in 2Q 2021 so far (range of 50.4 to 51.9) compared to 1Q 2021 (range of 50.9 to 51.5). Russia Services PMI rose to a robust reading of 57.5 in May, pushing the quarterly average to 56.4 2Q 2021 so far, up on 1Q 2021 average of 53.6. All in, Russian PMIs for both sectors are now in the second consecutive > 50.0 readings territory - a good signal. Composite PMI rose to 55.1 in 2Q 2021 to-date, compared to 53.2 in 1Q 2021. This marks the highest composite PMI for any BRIC economy for 2Q 2021 to-date. Just as with global and rest-of-BRICs cases, Russian inflationary pressures were running high in May. per Markit: "Price pressures remained high in May, with rates of private sector cost and charge inflation quickening notably. Sharper supplier price hikes and greater fuel costs reportedly spurred increases in cost burdens."
  • India: Manufacturing PMI slipped from 56.9 in 1Q 2021 to 53.2 in 2Q 2021 to-date, marking the second consecutive quarter of declining PMIs. May 2021 reading was at 50.8, signaling, statistically, zero growth conditions in the sector. Services PMI fell below 50.0 mark in May reaching 46.4, with 2Q 2021 reading so far standing at 50.2, down from 54.2 in 1Q 2021. Statistically, the 2Q 2021 reading to-date implies zero growth in the Services sector. As the result, India's Composite PMI fell to 51.8 in 2Q 2021 to-date, down from 56.4 recorded in 4Q 2020 and 1Q 2021. With domestic demand slipping, inflationary pressures remained high, but did not accelerate. per Markit: "The rate of input cost inflation at the composite level eased to a four-month low in May, with slower increases noted at manufacturing firms and their services counterparts. Aggregate selling prices rose moderately and at a rate that was similar to April's. The quicker rate of charge inflation was seen in the manufacturing industry."
  • China: China Manufacturing PMI remains relatively robust in 2Q 2021 so far (52.0) compared to 1Q 2021 (51.0), with levels of activity somewhat higher than historical average (50.7). Meanwhile, activity in the Services sector has accelerated, with Services PMI rising from 52.6 in 1Q 2021 to 55.7 in 2Q 2021. The latest Composite PMI reading remains robust at 54.3 for the first two months of 2Q 2021, compared to 52.3 in 1Q 2021, and above, statistically, historical average of 52.6. On inflation, Markit note states: "Both the gauges for input costs and output prices rose higher into expansionary range, indicating tremendous inflationary pressure. ...  "Policymakers mentioned rising commodity prices at the State Council executive meetings on May 12 and May 19. They issued instructions about stabilizing commodity supplies and prices. ... Inflationary pressure would limit the room for monetary policy maneuvering, which could hinder the economic recovery. Some enterprises began to hoard goods in response to rising raw material prices, while others suffered raw material shortages. Supply chains were also significantly affected.""


Per Markit, globally: "Higher employment also reflected companies' efforts to combat rising capacity pressures. Backlogs of work expanded at the fastest rate in 17 years, with stronger increases at both manufacturers and service providers. Demand outstripping supply also led to increased price inflation. Input costs rose to the greatest extent since August 2008 and output charges at the quickest rate on record (since at least October 2009)."

Two charts to illustrate the above trends:


Sunday, May 9, 2021

9/5/21: COVID19: BRIICS

 Updating data for BRIICS for Covid19 pandemic through Week 17 of 2021 (current week):


Almost half of all cumulated cases within the BRIICS (Brazil, Russia, India, Indonesia, China and South Africa) group are now in India (above) and almost half of all deaths are in Brazil (below).


The pandemic dynamics have turned decisively in recent weeks: in terms of new cases, India dominates the trend up, with all other BRIICS showing amelioration in the pandemic:


Similarly, for we weekly death counts:

China data remains utterly unbelievable and hard to trust.

Summary table of recent developments:


India's pandemic dynamics are shocking, horrific and show no signs of abating. This is a humanitarian disaster that requires help from the rest of the world - help that has been coming in too-little and too-late.


Saturday, May 8, 2021

8/5/21: COVID19: Most impacted countries

 Covering data through this week (week 17) of 2021 for world's most impacted countries.

First: most impacted countries by the rate of infections and by mortality:


There is only one large country (population > 100 million) that is listed in both tables: the U.S. 

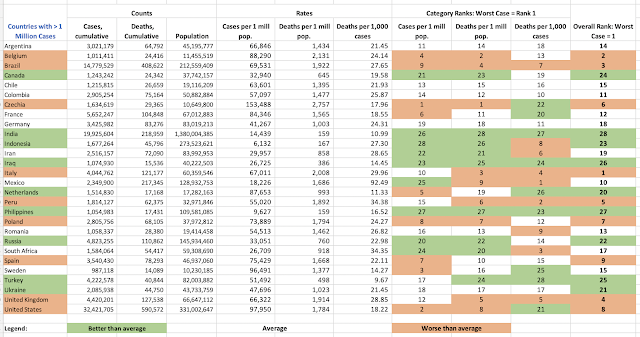
Now, a table of countries with more than 1 million cases:

The U.S. ranks 8th worst performer in the group of 28 countries with more than 1 million cases, when measured across all three metrics: infections per 1 million of population, deaths per 1 million of population and deaths per 1,000 of diagnosed cases. 

Looking at major countries groups in the context of the above table:

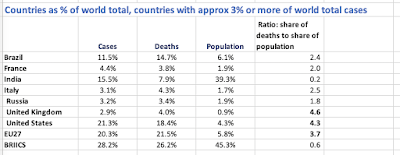
Finally, looking at the most impacted countries from the point of their relative contributions to global totals for cases and deaths:


Monday, April 19, 2021

19/4/21: COVID19: BRIICS

BRIICS are now in a fully-developed Wave 4 of the pandemic, like much of the rest of the world. This is confirmed across both new case numbers and weekly deaths counts:


I highlighted in the table below two BRIICS countries with seriously questionable data quality: China and India. China has been routinely reporting numbers that simply are out of line with anything reported by other countries around the world. India's death statistics appear to be similarly out line with experience in most countries. In the past, Russia received a lot of criticism for its reporting of Covid19 deaths, but their numbers do not appear to be out of line with other countries reported statistics.

These are six largest emerging and middle income economies in the world, and their pandemic dynamics, in the end, hold the key to the global efforts on combating the spread of the disease. Not surprisingly, these countries account for three of the four main variants of the disease to-date. If anyone thinks that Europe and North America can effectively insulate themselves from what is happening in these countries, by any means other than attaining a sufficient and robust immunity through vaccinations, they really need to reflect hard on their rational thought capacity.


19/4/21: COVID19: Most impacted countries


Updated tables for world's most impacted countries and regions below. Starting with the countries with the highest recognized levels of infections:


Followed by the countries with the highest rates of mortality:
  • Andorra, Montenegro and Czechia are top three countries in the world in terms of infections rates
  • Gibraltar, Czechia and San Marino are top three countries in the world in terms of mortality rates
  • Of larger countries, with population > 100 million, the U.S. is the only country featured on both lists, while Mexico is on the list of countries with highest mortality.
A set of table for countries with more than 250,000 recorded cases:


  • There are 57 countries on the list as of Thursday last week. 
  • Across three metrics used (infections rate, deaths per capita and mortality rate per case), Hungary is rated the worst, followed by Belgium and Bulgaria. Czechia and Slovakia share the 4th and 5th places.
  • The U.S. is ranked 3rd highest in the number of infections, in the 8th place in terms of highest deaths per 1 million of population and in the 32nd place in terms of deaths per 1,000 infections. Overall, the U.S. is ranked 8th worst country in terms of pandemic performance across the three metrics.
Table next shows comparatives by the same metrics across regions, treating regions as if they were countries (ranks):

Finally, looking at the major countries and groupings in terms of their cases and deaths counts within the context of their shares of global population:

Notably, majority of the most impacted countries are, currently, in the process of developing, or already experiencing, a new wave of the pandemic.

Tuesday, April 6, 2021

5/4/21: BRIC's Manufacturing PMIs: 1Q 2021


Given a lot of noise about economic re-opening and abatement of the late 2020 wave of the pandemic, we expected BRIC countries PMIs to improve significantly in 1Q 2021 compared to 4Q 2020. Alas, the opposite took place:


  • Brazil Manufacturing PMI fell from 64.1 in 4Q 2020 to 55.9 in 1Q 2021. All three months of 1Q 2021 came in sub-60 (all three months of 4Q 2020 were above 60) and March 2021 was the lowest monthly reading since June 2020.
  • Russia Manufacturing PMI slipped from 51.5 in February to 51.1 in March. On quarterly basis, Russia Manufacturing PMI actually managed to rise from a recessionary reading of 47.6 in 4Q 2020 to a weak recovery reading of 51.2 in 1Q 2021. This is the highest reading since 1Q 2019 and the first above-50 reading since the end of 2Q 2019. Russia was the only BRIC economy posting increasing PMI in Manufacturing sector in 1Q 2021, and at that, the improvement went to anaemic growth from pretty steep contraction.
  • China Manufacturing PMI disappointed, falling from 53.8 in 4Q 2020 to 51.0 in 1Q 2021. Given structural importance of Chinese manufacturing globally, this implies a further build up in orders backlogs in the global supply chains, signaling more inflationary pressures down the line. On a monthly basis, March 2021 posted fourth consecutive decline in monthly PMIs, with March reading of just 50.6 - statistically, basically indistinguishable from zero growth conditions in the sector.
  • India Manufacturing PMI fell from 57.7 and 57.5 in January and February 2021 to 55.4 in March 2021, marking the slowest monthly rate of growth since August 2020. On a quarterly basis, India Manufacturing PMI fell from a hard-to-believe rate of expansion of 57.2 in 4Q 2020 to still robust growth of 56.9 in 1Q 2021.
Brazil and India were the two BRIC economies that managed to outperform global manufacturing sector growth in 1Q 2021 which came in at 54.1, up on 53.5 in 4Q 2020.

Global GDP-weighted BRIC group Index of Manufacturing Activity that I calculate based on Markit data fell from from 54.8 in 4Q 2020 to 52.8 in 1Q 2021, reaching the lowest reading since 2Q 2020 when it was at 45.0. Whilst BRIC group Index of Manufacturing Activity outperformed Global Manufacturing PMI in every quarter between 1Q 2019 and 4Q 2020, it fell below the global measure in 1Q 2021.

Friday, April 2, 2021

2/4/21: COVID19: BRIICS

 As warned last month, BRIICS are now in a new wave of the pandemic, just like the rest of the world:


The new wave is worse than the previous one in terms of new weekly case counts and deaths. Brazil and India are leading the new cases pandemic, while Brazil leads in terms of deaths. Russia is relatively stable on deaths counts at highly elevated levels, while India death counts (highly suspicious in terms of low numbers throughout the entire 2021 so far) are now rising once again.

Table above shows summary of dynamics in current weekly cases and deaths relative to the prior 4 weeks average. 

These numbers strongly indicate that risk of pandemic will continue to spill over across the world, with no country immune to the new wave developing, until reaching 'herd immunity' levels via immunizations, assuming no adverse mutations in the virus.

1/34/21: COVID19: Most impacted countries

 Here is a set of summary tables for world's most impacted countries:


First, 17 countries with more than 7% of population tested positive:


And 16 countries with more than 0.15% of population dead:


Most are smaller in population countries. Outliers to this rule are:
  • The U.S. that enters both of the lists as the only country with population > 15 million
  • Mexico that enters the list for highest mortality countries (alongside the U.S.) - the only two countries on the list with population > 100 million
  • Spain, UK and Italy are the three countries on the deadliest countries list with population between 45 million and 99 million.
The new wave starting means I should update the table for most impacted countries based on case counts alone. Prior to this week, I tracked countries with > 250,000 cases. There are now too many of these to make this table meaningful, so in days ahead, I will update the methodology to report countries with > 500,000 cases. Stay tuned. 

Instead, here is the list of countries and regions with > 3 percent of total global cases:


Most of these are now starting a new wave of the pandemic. 


Sunday, March 14, 2021

13/3/21: COVID19 Update: BRIICS

Previous posts covered updates for Covid19 pandemic stats:

In this update, let's take a look at the dynamics of the pandemic in BRIICS (Brazil, Russia, India, Indonesia, China and South Africa) group of countries.

First, weekly case counts:


Brazil is leading BRIICS into what appears to be a new wave, Wave 4 of the pandemic. All other BRIICS countries are showing sustained moderation in new cases. There is also a much smaller uptick in new cases in India.

A similar picture emerges from weekly deaths data:


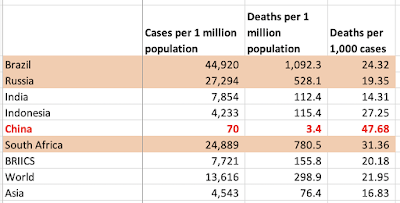
A summary table of per capita cases and deaths, as well as mortality rates.


One feature of the above dynamics is the state of uncertainty these highlight in the Emerging and Developing economies with respect to the recent improvements in the pandemic numbers. Sitting in the West, it is, perhaps (depending on the location) easy to slip into a state of overconfidence and complacency, as vaccines become more widely distributed and politicians trumpet the sight of 'normalcy' on the horizon. The problem with this worldview is three-fold:
  1. This pandemic will not go away until we reach - globally - levels of vaccinations and infections that deliver global 'herd immunity', which would require 90%+ immunity cover; and
  2. As long as there are large pools of the virus in the world at large, there will be higher likelihood (note: we do not know probability) of virus mutations that can render acquired immunity irrelevant, and
  3. We are currently not doing anything near enough to deliver vaccines to the countries outside the Advanced economies world.  

13/3/21: COVID19 Update: Most impacted countries

 In previous posts, I covered updates for Covid19 pandemic figures for:

  • Worldwide data: https://trueeconomics.blogspot.com/2021/03/12321-covid19-update-worldwide-data.html, and
  • Europe and the EU27 countries: https://trueeconomics.blogspot.com/2021/03/13221-covid19-update-europe-and-eu27.html.
Now, world's worst hit countries and regions.


World's 5 worst impacted countries by the number of cases per capita (the first table above), with ranks 1 = worst:

  1. Andora
  2. Montenegro
  3. Gibraltar
  4. Czechia
  5. San Marino
The U.S. ranks 9th worst in the world - the only country with more than 100 million population. There are three countries with population over 10 million but below 100 million on the list: Belgium (15th) and Portugal (11th), plus Czechia.

World's 5 worst impacted countries by the number of deaths per capita (the second table above), with ranks 1 = worst:
  1. Gibraltar
  2. San Marino
  3. Czechia
  4. Slovenia
  5. Belgium
The U.S. ranks 12th in the world - the only country with more than 100 million population in the list of worst-impacted in terms of deaths per capita. Notably, there are two countries with population between 50 million and 99 million on the list of the worst impacted countries by deaths per capita: Italy (ranked 8th worst in the world), and the UK (ranked 6th worst in the world). There are further 4 countries on the list with population over 10 million, but less than 50 million: Belgium and Czechia already referenced above, plus Portugal (ranked 11th), and Span (ranked 14th).


Two tables above summarize key statistics for the countries with more than 250,000 cases of Covid19 recorded. The table also provides overall rankings for these countries in terms of their performance across three metrics: cases per capita, deaths per capita and deaths per case.

Notably, ten worst countries based on these combined metrics are (once again, rank = 1 implies the worst overall performance):
  1. Belgium
  2. UK
  3. Italy
  4. Hungary (tied with Italy)
  5. Portugal
  6. Czechia
  7. Spain
  8. U.S.
  9. Bulgaria (tied with U.S.)
  10. Peru
Across major regions:


Note: in the above table, regions are ranked as countries, though countries' rankings do not include regions. Thus, if the EU27 was treated as a country, it would rank 19th worst in the list of countries. If we remove EU27 member states from the list, the EU27 itself would rank 9th worst in the list, just below the U.S. which continues to perform worse than the EU27, but only marginally. 

Finally, countries' and groups' shares of deaths relative to their share of world population:


The U.S. is the second worst performing major country with its ratio of its share of world deaths to its share of world's population standing at 4.7. The UK is the worst, with a ratio of 5.6 and the EU27 third worst with a ratio of 3.8. 

Sunday, February 14, 2021

14/2/21: COVID19 Update: BRIICS

 In previous posts, I covered the latest data for weekly Covid19 pandemic dynamics for:

Now, let's take a closer look at the pandemic dynamics in the BRIICS (Brazil, Russia, India, Indonesia, China and South Africa).


In broadly defined terms, there is an ongoing decline in both new cases and new deaths over the last week across all BRIICS. That said, it is too early to call the peaking of the second wave of this pandemic in terms of deaths counts, since weekly counts remain extremely high and show only one week of sustained declines. The good news is that last week's declines were evident in all BRIICS. Another good news is that we now have at least four consecutive weeks of declines in new cases across the entire group, except for Indonesia, where we only have one week of declines, and China. 

A summary table:


14/2/21: COVID19 Update: Most impacted countries


Previous posts on the COVID19 update covered global numbers and trends (https://trueeconomics.blogspot.com/2021/02/14221-covid19-update-worldwide-data.html) and European & EU27 trends (https://trueeconomics.blogspot.com/2021/02/14221-covid19-update-europe-and-eu27.html).

Here are some comparatives across all countries with the highest rates of detected infections (> 5% of population):


Note: I highlighted countries with > 10 million population.

Another way of looking at this is to take countries with more than 250,000 confirmed cases, as presented in the next set of tables:


Comparing regions to the above countries:

And looking at the countries by population relatives:

The table above really drives home the depth of the crisis in Europe and the U.S. U.S. accounts so far fo 20 percent of global deaths, having just 4.3 percent of the global population. This gives the U.S. second worst ratio of its share of global deaths to its share of world population. Only the UK exceeds the U.S. in this horrific metric. The EU27 fall in the third place, below the U.S. with 21.4% of the world's deaths and 5.8% of the global population. 


Wednesday, January 6, 2021

6/1/21: BRIC: Composite Economic Indicators: 4Q 2020

Now, Composite PMIs:
  • Brazil Composite PMI rose from 51.6 in 3Q 2020 to 54.4 in 4Q 2020, marking second consecutive quarter of > 50.0 readings. Average 4 quarters PMI stands at 46.2, suggesting that Brazil's economy has not, yet, recovered fully from the Covid19 pandemic impact. Nonetheless, statistically, both 3Q and 4Q readings are signaling economic expansion and 4Q growth in Brazil's economy appears to be faster-paced than global (global composite PMI was at 53.3 in 4Q 2020).
  • Russia Composite PMI is in a contraction territory, with 4Q 2020 reading of 47.7, down from 55.9 in 3Q 2020. Over the course of 2020, Russia Composite PMI averaged 46.0, the second weakest in the BRICs group. At 47.7, 4Q 2020 PMI is exactly in line with 1Q 2020 PMI.
  • India Composite PMI rose from 45.9 in 3Q 2020 to 56.4 in 4Q 2020, signaling rapid bounce back in the economy, that, nonetheless continues to suffer from the pandemic-induced economic crisis. Full year 2020, Composite PMI average is at 44.3, by a distance, the lowest in the BRICs group. 
  • China Composite PMI rose from 54.7 in 3Q 2020 to 56.3 in 4Q 2020, marking third consecutive quarter of economic growth, with full year PMI averaging 51.4, suggesting that the Chinese economy has now recovered fully from the Covid19 pandemic impact. 

Overall, three out of four BRIC economies posted 4Q 2020 Composite PMI above Global Composite PMI: Brazil, India and China, with Russia being the only BRIC economy posting both sub-Global and sub-50 Composite PMI reading at the end of 2020. Only one BRIC economy has, so far, signaled full recovery from the Covid19 crisis shock: China, with all other BRICs still recovering from the pandemic.

Given that both BRIC Manufacturing Sector Activity Index (54.9 in 4Q 2020) and BRIC Services Sector Activity Index (54.8 in 4Q 2020) are above Global Manufacturing (53.5) and Services (52.3) PMIs, BRIC economies as a group have supported global economic growth to the upside in 4Q 2020. In contrast, BRIC Manufacturing Activity Index outperformed Global Manufacturing PMI in 3Q 2020 (53.0 to 51.6), while BRIC Services Activity Index (51.0) underperformed Global Services PMI (51.4). 

6/1/21: BRIC: Services PMIs: 4Q 2020


BRIC's manufacturing PMIs for 4Q 2020 were covered here: https://trueeconomics.blogspot.com/2021/01/4121-bric-manufacturing-pmis-4q-2020.html. Now, to Services PMIs:

  • Brazil Services PMI rose from 47.5 in 3Q 2020 to 51.4 in 4Q 2020, with aggregate 2020 levels of activity still significantly below 2019 levels. At 51.4, the index is barely statistically above 50.0 (95% confidence bound is 51.3). However, the latest quarterly reading is the first nominally above 50.0 after three consecutive quarters of sub-50 readings. 
  • Russia Services PMI crashed in 4Q 2020 from 56.8 in 3Q to 47.7. Statistically, Russian services sector is contracting and it is contracting rapidly. In the entire 2020, there were three quarters of deeply sub-50 readings against one quarter of above 50.0 expansion. Services sector reading is basically identical to 47.6 recorded in Manufacturing sector, which means that in 4Q 2020 there was no 'comfort zone' in the Russian economy in terms of growth.
  • India Services PMI rose significantly in 4Q 2020 compared to 3Q 2020, from 41.9 to 53.4.  However, this growth is unlikely to bring India's services activity anywhere near pre-Covid19 levels. 
  • China Services PMI rose for the third consecutive quarter in 4Q 2020. In 2Q 2020, China's Services PMI was at 52.6, which increased to 54.3 in 3Q 2020 and to 57.0 in 4Q 2020. Nonetheless, it is still doubtful that Chinese services activities have fully recovered from the pandemic as of the end of 2020.
  • Overall, BRIC Services Activity Index based on PMIs and respective GDP shares in the global economy rose for the second quarter in a row from 51.0 in 3Q 2020 to 54.8 in 4Q 2020. This marks some recovery from the Covid19 pandemic impact, although this recovery remains incomplete. BRICs have - as a group - outperformed Global Services PMI which rose from 51.4 in 3Q 2020 to 52.3 in 4Q 2020.

Monday, January 4, 2021

4/1/21: BRIC: Manufacturing PMIs 4Q 2020

Latest data for BRIC Manufacturing PMIs indicates three countries outperforming global rate of recovery in manufacturing sector, against one country (Russia) remaining in contraction territory and well below global growth mark.


On a quarterly basis,

  • Brazil's Manufacturing PMI stood at 64.1 in 4Q 2020, up on 62.6 in 3Q 2020, marking the second highest and the highest reading on record. The contraction in 2Q 2020 (with PMI at 42.0) was sharp, but not as sharp as in 1Q 2009. By these comparatives, GFC-related contraction of 2008-2009 resulted in 4 quarters average reading of 45.1 and saw three consecutive sub-50 readings. The Covid-19 related contraction was stretched only across one quarter, with 4 quarters average of 54.8 in 2020. It is, genuinely, hard to reconcile these numbers with reality of the Covid-19 crisis.
  • Russia Manufacturing PMI slipped to 47.6 in 4Q 2020 from 49.5 in 3Q 2020, marking sixth consecutive quarter of sub-50 readings. Statistically, Russian Manufacturing posted no growth (> 50 readings) in seven consecutive quarters. Over 2020 as a whole, Russian PMIs averaged abysmal 46.0, compared to the GFC and the Great Recession average of 2008-2009 of 44.7.
  • India Manufacturing PMI was at 57.2 in 4Q 2020, up on 51.6 in 3Q 2020, and averaging 49.5 for the year as a whole. During the GFC and the Great Recession period, India's PMI averaged at 51.1. Unlike Brazil, India is yet to recover to pre-Covid-19 levels of activity.
  • China Manufacturing PMI finished 2020 with a reading of 53.9, averaging 51.1 over 2020 as a whole, with overall PMIs performance suggesting that Chinese industrial producers have recovered from the Covid-19 pandemic by the end of 2020. China's Covid-19 experience has been more benign than the country contraction during the GFC and the Great Recession (46.9 average).
Global Manufacturing PMI stood at 53.5 in 4Q 2020 and an average of 49.3 over 2020 as a whole, against BRIC's Manufacturing Index (weighted by relative global GDP shares of the four economies) at 54.9 in 4Q 2020 and 50.5 for 2020 as a whole. In other words, BRICs have supported global growth to the upside during the Covid-19 pandemic. 

Saturday, January 2, 2021

2/1/21: Covid19 update: BRIICS

 In previous posts, I covered Covid-19 updates for the last week of 2020 for:

Cumulative data for BRIICS (Brazil, Russia, India, Indonesia, China and South Africa) shows continued steady expansion of the pandemic in total cases and deaths:


  • Currently, BRIICS account for 28.2% of all cases of Covid-19 in the world, and 25.3% of all deaths. This compares to these countries accounting for 45.3% of the world population.
  • The pandemic has been relatively benign for this group of countries. If BRIICS were ranked as a stand-alone country within the group of 40 countries with more than 250,000 cases, BRIICS would have ranked 38th worst in terms of cases per 1 million of population, 37th worst in terms of deaths per capita, and 28th in terms of deaths per case. 
  • BRIICS data, however is highly heterogeneous by country: 
    • Brazil ranks 11th worst-hit country in the world in terms of infections rate, death rate per capita and mortality rate; 
    • Russia ranks 28th;
    • India ranks 38th;
    • Indonesia 31st;
    • China is unranked (officially, the country has fever than 250,000 cases, although overall robustness of the Chinese data is highly questionable); and
    • South Africa ranks 22nd worst.
  • No BRIICS country enters the league of 22 countries most-impacted by the pandemic (defined as countries with infection rate of 4% of population and higher).

Most current summary of key stats is below:


Now, to dynamics and trends.


BRIICS weekly case numbers are on the sustained rise, once again, since the trough achieved in week 45 which marked the end of the Wave 1 and the start of Wave 2 of the pandemic:


India and Brazil are showing robust and weakly-robust declines in weekly cases, while Russia and South Africa are showing robust increases. Other BRIICS are on a weak upward trend. Put frankly, my expectation is for a rise in India cases in weeks ahead as the new wave of the pandemic starts to take hold. Brazil being in a summer season is likely to have a longer lead time into the new wave.

Rather similar dynamics are taking place in deaths counts:


One key feature of the data is, of course, the clearly unreliable data from China that skews overall picture for the BRIICS group as a whole. If China's data was running at 0.75-0.9 of the average BRIICS rates, the country would have reported over 9.26 million cases (as opposed to the officially-reported 96,292 cases) and 183,400 deaths (compared to the officially-reported 4,771 deaths). It is worth noting here that these estimates reflect BRIICS rates that include official China statistics (downward bias to the estimates). What is quite amazing is not the actual numbers themselves, but the nearly total silence on the state of the Chinese statistics in much of the Western media, despite the order of differences between China and other BRIICS. Take a look at the comparative table here:


Russian stats: scrutinized left, right and center on every op-ed and news page of all major media outlets in the West are pretty much bank-on as expected: worse than average in infection rates, worse than average in deaths per capita, roughly (statistically) below average in terms of mortality rate. Similar for India. China's data is a complete and total outlier, and yet not a peep from the mainstream news.