Updating data for COVID19 pandemic worldwide:
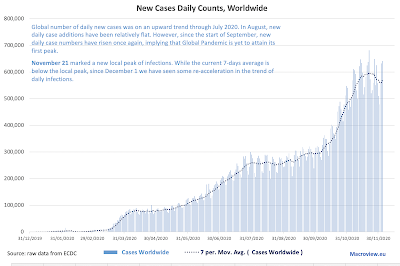
Global number of daily new cases was on an upward trend through July 2020. In August, new daily case additions have been relatively flat. However, since the start of September, new daily case numbers have risen once again, implying that Global Pandemic is yet to attain its first overall peak.
The chart above clearly shows the difficulty in interpreting global peak of the pandemic. Overall, notionally, we have experienced what appears to be three waves:
- Wave 1 peaked around April 9th and the first trough took place around the end of April.
- Wave 2 started from the first days of May and peaked between August 1 and August 14.
- Wave 3 started from the second trough of August 27-29th and has (to-date) peaked around November 21.
However, statistically, neither Wave 1 nor Wave 2 attained a true peak, as post-local peak troughs were to shallow to genuinely mark a statistically significant deviation from each prior local peak.
In other words, there is little in the data to allow us to call the aforementioned Waves 1 & 2 as genuinely distinctive waves of the pandemic.
Unlike new cases, daily deaths show more distinct waves patterns. Specifically,
- Wave 1: peaking around April 22 generated a post-peak trough around June 3 that is statistically significantly below the peak values. This defines a statistically valid wave.
- Wave 2: starting from around June 7 and peaking around August 13. This wave ended in a trough of September 22 which is not statistically significant at 95% confidence level. This means it is harder to call this a genuine wave.
- Wave 3: starting from around October 23 and currently still accelerating. There is zero doubt that this is a well-defined wave.
With this in mind, even moderated rates of growth wee have witnessed since the start of December are worrying. Here are two tables summarising monthly statistics for bot cases and deaths and growth rates statistics in both new cases and deaths.
In summary, the pandemic continues to rage and it appears that much welcomed moderation in the new cases dynamics witnessed in the last week of November is unlikely to hold. Worse, within a week, we will be going into pre-holidays mode around the world and in the U.S. we will be also experiencing lagged cases uplifts due to Thanksgiving travel.
Stay safe everyone: December will be a hellish month.


No comments:
Post a Comment