Showing posts with label duration of unemployment. Show all posts

Wednesday, April 14, 2021

14/4/21: The share of those in unemployment > 27 weeks is rising


One way to look at the state of the real (as opposed to financialized and corporate-value focused) economy is to look at unemployment. And one of the strongest indicators of longer term changes in the structure of the real economy is the fate of the longer term unemployed. Here is an interesting snapshot of data: the percentage of those unemployed for 27 week or longer in the total pool of the unemployed. The higher the number, the more structural is the unemployment problem. 


If the above is not clear enough, here is the same data expressed in the form of the range for each 12 months period (rolling) between maximum share of the longer term unemployed in the overall pool of unemployment and the minimum share:


All of the above suggests we are in deep trouble. And this trouble has been persistent since the Great Recession: we are witnessing a dramatic increase in the duration of unemployment spells. Part of this is due to the impact of Covid19 pandemic concentrated in specific sectors. Part of this is down to the generosity of unemployment benefits supplements and direct subsidies during the pandemic. Part of it is also down to the longer term changes in the U.S. labor markets and changes in households' composition and investment/consumption patterns.

Irrespective of the causes, the problem is obvious: the longer the person remains unemployed, the sharper is the depreciation of skills and their employability. If this (post-2008) experience is the 'new normal', America is developing a massive class of disillusioned and human capital poor workers. 


Sunday, May 3, 2020

3/5/20: Updated: The Scariest Chart in Economics


Updating one of the two 'Scariest Charts' in economics with the latest data - preliminary, through April 25, 2020:


This goes hand-in-hand with the earlier chart here: https://trueeconomics.blogspot.com/2020/05/3520-updated-shocking-wave-of-jobs.html

The speed and the depth of jobs destruction in the U.S. during the last two months has been beyond precedent. 

Thursday, April 23, 2020

23/4/20: U.S. Labor Force Participation Rate Heading into COVID19 Disaster


Adding to the two scariest charts in economic history (see https://trueeconomics.blogspot.com/2020/04/1942020-two-scariest-charts-in-economic.html), a third chart, showing changes in the U.S. labor force participation rates during and following recessions:

The above clearly shows that 2008-2009 recession has been unique in the history of the U.S. economy not only in terms of the unprecedented duration of unemployment (link above), but also in terms of the scale of exits from the labor force. In fact, this was the first recession on record that resulted in post-recession recovery not reaching pre-recession high in terms of labor force participation rates.

Sunday, April 19, 2020

19/4/2020: Two Scariest Charts in Economic History


I have been posting quite a bit on U.S. unemployment and jobs destruction numbers coming from the COVID-19 pandemic. So here are two charts to watch into the future, and I will be updating these throughout the crisis here.

The first chart plots evolution of non-farm payrolls index for each official recession. I used as the index base average payroll numbers for 6 months prior to the first month of the recession. I then compute and plot the index from month 1 of the recession through the last month prior to the next recession.


The second chart is the average duration of unemployment claims or average weeks unemployed. Again, series start from the first month of officially-declared recession and run until the subsequent recession.

Both charts illustrate the contradictory nature of the post-2008-2009 recession recovery. Whilst the recovery has been the longest in duration (chart 1 above), it has not been the most dramatic in terms of employment creation relative to prior pre-recession peak (line "2008-2009" solid segment runs longer than any other line, but does not gain heights of at least 6 prior recoveries.  Per chart 2 above, recovery from 2008-2009 recession has been associated with unprecedented length of duration of unemployment. The series here stop at the end of February 2020, so they do not account for the recent jobs losses, simply because there has not been, yet, official announcement of a recession.

You can read on March-April jobs losses here: https://trueeconomics.blogspot.com/2020/04/16420-four-weeks-of-true-unemployment.html and in the context of prior recessions here: https://trueeconomics.blogspot.com/2020/04/18420-shocking-wave-of-jobs-destruction.html.

Stay tuned, as I will be updating these two charts as data arrives.

Monday, June 3, 2019

3/6/19: Average Duration of Unemployment in the U.S.: Still High by Historical Comparatives


Remember my 'scary chart' from the day back? The one plotting the persistently high - relative to the business cycle - duration of unemployment in the U.S.?

I have not updated this chart for some years now. So here is a new version based on the latest data:


Two things worth noting:

  1. Declines in unemployment and rises in employment in recent years have been accompanied by a rather dramatic decline in the average duration of unemployment claims in the U.S. This is reflect in the drop in the cyclically-adjusted average duration of claims evidenced in the chart.
  2. However, by all historical comparatives, the current business expansion cycle continues to be associated with significantly higher average duration of unemployment, compared to the pre-recession average.
In other words, not all is rosy in the labor markets.

Monday, January 2, 2017

2/1/17: U.S. Unemployment Duration is Still Record-Busting


Throughout recent years, the recovery meme, played across the mainstream media in the U.S. has provided endless support to President Obama’s approval ratings. During POTUS 2016 election, the said meme was used by Hillary Clinton to challenge the ‘things aren’t so great in America’ views of Bernie Sanders and, subsequently, the echoes of the same from Donald Trump. Since the election, the recovery story has been billed as the ‘strong economy’ legacy that President Obama will be leaving for his predecessor to mess with - the basis for setting up the incoming Trump Administration for any potential fall, should economic fortunes of the recovery were to falter.

The central point of the U.S. recovery story - absent any appreciable growth in productivity, capital investment, and sectoral value added - was the only bright spot on the U.S. economic horizon: the labour markets. In fact, the U.S. headline unemployment figures have shown very strong gains, and jobs creation has been robust, with more recent data showing improvements (at long last) in households’ incomes. All of these indicators can and have been robustly challenged in terms of the extent to which they show true nature of improvements. However, they have been taken, predominantly, as read. Improvements are improvements, and gains are gains.

And as the readers of my blog and media articles would have known, the story is never complete, if one looks only at headline figures. Reality is always more complex.

So to show you this complexity at work, let’s look at one official indicator of the health of the labour markets in the U.S. - duration of unemployment. If the U.S. economy is really awash with jobs, and if the true unemployment rate is really sitting at 4.9 percent, the duration of unemployment should not only be declining on average, but it should be closer to ‘normal’ non-recessionary reading. Right?

Take a look at the following chart based on data from the St Louis Federal Reserve database, Fred:


Yes, duration of unemployment peaked in January 2011 at 40.7 weeks and since then fallen to 26.3 weeks (as of November 2016), but 26.3 weeks for average unemployment benefits duration is still above any previous recession since 1948 on.

Now, as er return to normalcy. During 1990-1991 and 2001 recessions, recovery failed to completely reduce average duration of unemployment back to pre-recessionary norms. In simple terms, after the end of recession, in 1990-1991 and 2001 downturns, on average, unemployed people remained in unemployment longer than before recessions. These were the first two recession on record that resulted in this change in structural unemployment duration.

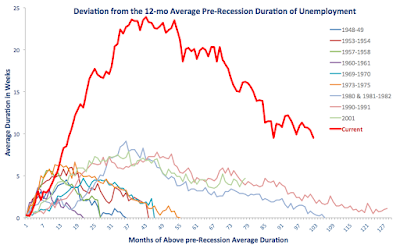
Now, consider 2008 recession. Chart below illustrates what happened to the ‘new normal’ duration of unemployment spells. Specifically, chart below plots the difference between average duration of unemployment during recession and recovery and the average duration of unemployment in 12 months prior to the onset of each recession. Returning to normal here would mean getting duration gap closer to zero.


Again, current (since 2008) recovery is clearly the worst for all post-recessionary episodes on record. Currently, duration of unemployment is 9.5 weeks, on average, longer than it was during the last 12 months of pre-2008 recession. Which is bad enough to be worse than the peak deviation for any recession in modern history.

What is happening here? The fabled U.S. jobs creation recovery is really a combination of several factors. One of these is genuine increases in jobs being created, which drives unemployment down. Another is demographic: U.S. labour force is expanding, and as it does, employment creation get swallowed by new entrants into labour force, while many existent unemployed are either exiting the labour force, or remaining on unemployment benefits longer. Of course, putting younger workers to work is a good thing. But squeezing older unemployed out of workforce is not.

There are serious problems with highly elevated (to-date) duration of U.S. unemployment that few politicians are willing to talk about. For one, longer duration of unemployment implies lower probability of transition into employment. Secondly, it also implies higher probability of future unemployment in future recessions. Thirdly, it implies more severe losses in skills, human capital, health, social well-being, etc. In other words, costs of unemployment rise faster for longer duration of unemployment.

Which makes you pause and think: is the legacy of the Obama administration on jobs is that impressive? Really? Well, stay tuned for more...

Saturday, September 5, 2015

5/9/15: Updating America's Scariest Chart


As you know I rarely post on the U.S. economy. But recently I was updating a presentation involving the state of financial flows for retail investors and savers around the world and had to check up on my old chart that I labeled America's Scariest Chart Redux (see previous update here).

Keep in mind the dominant media meme: the U.S. economy has been growing at a robust rate and the Great Recession has been officially over now for 74 months.

So where does the current unemployment duration (in terms of average duration in weeks) stand?


Err... average duration of unemployment in the U.S. is currently at 28.4 weeks.  Over 12 months period before the onset of the Great Recession, duration averaged 16.8 weeks. Which means that even today, a full 87 months after the start of the Great Recession, average duration of unemployment is 11.6 weeks longer than it was before the crisis. Current deviation from pre-crisis levels in average duration of unemployment is consistent with this measure of labour markets performance in months 17-18 of the crisis.

Worse, we are now (still) in a situation where people on unemployment benefits are staying in unemployment longer, on average, than in any other recession on record.

Now, let's revisit the 'official' former Scariest Chart - the index of employment also plotted by each recessionary period. This chart used to be published regularly, but since end of March 2014, U.S. employment index has finally reached pre-crisis levels of employment and everyone forgot the said chart. Too bad. Here it is, updated to the latest data:


And guess what? The chart above clearly shows that the current period of 'recovery' is still the worst in terms of employment performance than any previous recovery on record.

Just thought you would like an update...

Wednesday, November 26, 2014

26/11/2014: QNHS Q3 2014: Long-Term Unemployment


As usual with QNHS release, I will be covering a number of various angles relating to the latest unemployment data in a number of posts.

Let's start with duration of unemployment.

Overall, some good news. Official unemployment numbers fell 13.2% y/y in Q3 2014 (a decline of 37,400) for all duration categories. However, the rate of decline has moderated in Q3 compared to Q2. In Q2 2014 y/y drop in unemployment was 15.4% (down 46,200), which means that Q3 unemployment decline was 19% lower than the same y/y decline in Q2.

Across all demographic groups, unemployment with duration of less than 1 year dropped 9.9% y/y in Q3 2014 (a decline of 11,300). Again, this is good news. And again the good news are slightly moderated by the fact that the rate of decline has slowed down in Q3 compared to Q2 when unemployment of duration less than 1 year declined by 14.9% (down 18,200).

Long-term unemployment (1 year and longer) across all demographic groups was down 15.7% in Q3 2014 (down 25,900). This is excellent news in general as long-term unemployment is the hardest to shift. However, the rate of decline in long-term unemployment was also slower in Q3 2014 than in Q2 2014. Another good news is that the decline in long term unemployment was concentrated in the middle-age cohorts of 25-44 year olds where long term unemployment dropped by 17.7% y/y in Q3 2014 (down 15,800).


Key relative stat here is the relative share of long-term unemployed in total pool of the unemployed. This is illustrated in the chart below:


The chart shows several interesting trends:

  • Overall share of long term unemployed amongst all unemployed has been trending down since the crisis period peak reached in Q1 2012 (63.5%) and currently it stands at 58.0%. The trend, however, is rather shallow;
  • The shallow nature of the trend in long term unemployment as a share of total unemployment is driven by one group: those aged 25-44.
  • Contrasting this, there has been a roughly volatile and sharply declining trend in long-term unemployed share of total unemployment for those aged 15-24 years of age. Much of this decline is, however, driven by the changing nature of our unemployment benefits system, emigration and state training programmes, rather than jobs creation.
  • A worrying trend is for the demographic of 45 years of age and older. Here, there is an effectively flat trend in the share of long-term unemployed relative to total number of unemployed. Q3 2014 is showing a decline in this share to 69.1%, but that is bang on comparable to Q1 2014 share and is almost identical to 69.3 share in Q3 2013.


The last bit is worth highlighting a little more. As chart below shows, we are still on a rising trend in terms of the 45 year olds and older cohorts as proportion of all unemployed by duration:


In other words, we are facing a big problem in dealing with older unemployed and especially with older long-term unemployed.

Two tables below summarise the main results for changes in y/y terms and compared to Q1 2011.


Tuesday, November 25, 2014

26/11/2014: A Chart to Illustrate the Danger of Long-Term Unemployment


Quite a powerful reminder to us all as to the extent of the damage done by longer term unemployment. Here is the US data for the probability of regaining the job based on duration in unemployment:
Source: http://oregoneconomicanalysis.com/2014/11/10/graph-of-the-week-transition-probabilities/

Ignore the numbers on the right (for now):

  • Probability of regaining a job for those with less than 5 weeks duration of unemployment is ca 35-36% currently in the US.
  • Probability of regaining a job for those with unemployment duration of 15-26 weeks (under 6 months) is roughly 18%. That's half the rate of those at the shortest end of unemployment duration.
  • Probability of regaining a job for those in unemployment longer than 53 weeks (roughly year +) is just a notch above 10%.
Another set of regularities worth noting is:
  • For all durations, probability of regaining a job after an unemployment spell is showing a downward trend since the late 1990s.
  • The steepest decline in probability of regaining the job (trend) is evident for mid-range duration.
This is scary. In effect this suggests that unemployment in the US is becoming more structural over time, despite the claims of the rising economic systems resilience and flexibility. 

Now, onto numbers on the right: these reflect how much of the gap in probability of regaining a job between the pre-crisis high and the crisis period low has been closed to-date.  Now, the author of the post is celebrating that the gap is closing. Fine by me. except do remember - the peaks referenced in the chart go back to mid-2007. Which means we are now 7 years and a quarter, or so, that the crisis has been raging and the best the US has to show is 71% gap closure for short term unemployed. This is what we today call 'the best recovery' amongst the advanced economies. Imagine how horrific it is in the 'less impressive recoveries' of other advanced economies.

Saturday, August 30, 2014

30/8/2014: Irish Unemployment: The Plight of Long-Term Unemployed Older Workers


Some blogposts based on the latest QNHS data for Q2 2014 are due next, so to start with:

Duration of Unemployment in Ireland:

Two tables below summarise y/y and current on Q1 2011 (tenure of the present Coalition Government) changes in unemployment by age groups and duration of unemployment.

Couple of things worth mentioning (keep in mind, analysis of other aspects of unemployment are to follow, so we are focusing here on duration of unemployment):

  1. Overall unemployment declined. This is good news, albeit not very new nor very interesting.
  2. Y/y there were more significant declines in long-term unemployment for all those in the labour force (year on year, down 16.3% for those unemployed 1 year and over as opposed to a decline of 15.4% for those in unemployment in general). 
  3. There were comparable declines in unemployment compared to Q1 2011 for those in long-term unemployment (down 17.2%) as for all unemployed (down 17.3%).
  4. Caveat to (2) and (3) above: while these are good numbers, longer term unemployment declines are more heavily influenced by drop outs from the workforce than other durations.
  5. In year-on-year terms, 15-24 years old have performed significantly better than average in terms of declines in unemployment of any duration and somewhat better than average in terms of declines in long-term unemployment. This suggests that some component of the current younger long-term unemployed is still structural - and cannot be easily removed by switching them into either education, training or into new jobs. Younger long-term unemployed also performed better than average for their reference group in terms of current levels compared to Q1 2011. This suggests that there have been some successes in shifting younger people off unemployment and longer-term unemployment too. Which is good news.
  6. In year-on-year terms, mid-age group of long-term unemployed outperformed the average in terms of declines in unemployment (-20.9% against -16.3% average). But overall declines in unemployment in this group are basically around average (-15.8% against -15.4% for the overall group). Things are better for this category of workers both in short and long-term unemployment when compared to Q1 2011. Again, this is good news.
  7. Bad news are for the category of workers 45 years of age and over. Why? In year-on-year terms, their unemployment rates declined less than across all age categories (-11.8% for all 45+ years of age against -15.4% for all workers) and in comparison to Q1 2011, their unemployment levels are higher (+2.7% for all 45+ years of age against -17.3% for all workers). Even worse news are for the long-term unemployed workers of age 45 and over: their unemployment rates declined much less than across all age categories (-8.1% for all 45+ years of age against -16.3% for all workers) and in comparison to Q1 2011, their unemployment levels are significantly higher (+14.4% for all 45+ years of age against -17.2% for all workers). This is the bad news: older workers are becoming increasingly less and less employable and the jobs being created in the economy, as well as training and activation schemes made available by the state are not working for this group.
Thus, overall, share of longer-term unemployed is declining, but remains still very high, while share of the long-term unemployed in the older age cohort of workers is rising:


The problem of long-term unemployment is bad enough - unemployment of duration in excess of 6-12 months has very long-term effect on employability of the workers, their skills, their psychological well-being, but also permanent effect on their wages and the probability of future jobs losses spells, and so on. The problem of long-term older workers is worse. Workers left without the job for a year or so, whilst in their older age are facing much greater barrier to re-entry into the workforce and suffer much more significant losses to their pensions, health status and social standing than their younger counterparts. They are also much harder to re-train and up-skill, so activation programmes generally designed to deal with the acute unemployment crises are not suitable for their needs. 

Stay tuned for more analysis of QNHS figures.

Sunday, July 20, 2014

20/7/2014: The New Scariest Chart in Economics: June 2014 Update


Some time ago I started tracking the New Scariest Chart of the Crisis - the one plotting duration of unemployment in the U.S. and here is the latest monthly update:


Data on which the above is based is here:


Background to the chart is here: http://trueeconomics.blogspot.ie/2014/06/662014-king-of-scariest-charts-is-dead.html

Friday, June 6, 2014

6/6/2014: The King of Scariest Charts is Dead... Long Live the King...


Over recent years, I occasionally returned to the famous CalculatedRisk chart plotting jobs recovery in the Great Recession against the record of post-war US recessions. At last, today, the US economy has completed the arduous task of getting back to the pre-crisis level of employment.

The chart is completed:


The job is done. 76 months - longer than 46 months in the previous record-busting recession of 2001 - it took for the US economy to regain the pre-crisis milestone.

But the lessons are yet to be learned. Since 1981 recession, every recession has been worse and worse in terms of speed of jobs recovery. Why?

Since 1981 recession, the US deployed ever increasing firepower to fight off adverse effects of recession on jobs markets. And the task is not getting easier. Why?

And finally - a scary chart to replace the above scary chart: duration of unemployment in the US has been on a massive upswing during the current Great Recession and it is yet to yield its highs:


Scary charts do go away... but this one is likely to stay with us for some time... most likely - till the next recession hits...

Friday, February 28, 2014

28/2/2014: Duration of Unemployment: QNHS Q4 2013


Continuing with the coverage of Q4 2013 QNHS results for Ireland:
- First post covering detailed analysis of employment by sectors: http://trueeconomics.blogspot.ie/2014/02/2722014-employment-by-sectors-qnhs-q4.html
- Second post covering employment across broader sectors and categories: http://trueeconomics.blogspot.ie/2014/02/2822014-new-employment-across-broader.html
- Third post covering Participation and Unemployment Rates: http://trueeconomics.blogspot.ie/2014/02/2822014-participation-and-unemployment.html

In the current post let us consider changes in duration of unemployment.

The CSO reports two basic duration metrics:
- Less than 1 year,
- 1 year and over
And the data covers different age groups:
- All population 15 years and older
- Population 15-24 years of age,
- Population 25-44 years of age, and
- Population 45 years of age and older.

Here are the charts and quick commentary on these. The data is not seasonally-adjusted, so there is a lot of volatility and I am not going to do q/q analysis here.

For overall population 15 years of age and over:

  • Q4 2013 total unemployment declined 14.05% (41,400 in level terms) compared to Q4 2012. In 2012, Q4 y/y decline was -6.1% (-19,300 in level terms). Thus, 2013 numbers are much better compered to 2012 numbers, as one should expect.
  • Of these, unemployment numbers for duration less than 1 year have declined 18% (-20,900) in Q4 2013. Te good news - this reversed 2012 y/y rise of 2.0% (+2,300).
  • Unemployment with duration over 1 year has fallen as well, in Q4 2013 this was down 11.8% (-20,900) compared to Q4 2012, which is a small gain on decline recorded in Q4 2012 (y/y -10% and -19,700).

So good news here is that numbers are declining for both long-term and short-term unemployed. However, while overall unemployment numbers have now fallen to the levels below those recorded in Q4 2009 (though ahead of those in Q4 2008), long-term unemployed numbers are down to the levels below those recorded in Q4 2010 and are way ahead of those in Q4 2009.


Since the current Government came to power (H1 2011), unemployed numbers for those over the age 15 are down 59,300, of which 36,050 declines came from the ranks of short-term unemployed and 22,050 declines came from the ranks of long-term unemployed.

Given the difficulty of reducing long-term unemployment compared to short-term unemployment, this is still a good record.

However, given that we do not know how many of long-term unemployed are gaining jobs vs how many are dropping out of the labour force (emigration or exits from workforce) we really have little to go in identifying how god the above aggregates really are.

Charts below plot unemployment by duration for different age groups.


Youth unemployment (15-24 years of age) is shrinking. Across total youth unemployment, in Q4 2013 numbers unemployed fell 17.3% y/y (down 10,200 in level terms), building on 12.9% (-8,700) decline in Q4 2012.

Compared to H1 2011, youth unemployment is down 19,950 (-29%) overall, with 11,000 of this decline coming from short-term unemployed figures and 8,450 from long-term unemployed ranks.

The problem with the above numbers is that we do not know the sources for these declines in youth unemployment. These, in addition to people gaining jobs, include demographic transition (entry of new young workers and exists of previously younger workers into the next category of 25-44 year olds), exits to and entries from education and training, including State Training programmes, emigration, including short-term migration on post-education visas and so on).

The weakest performance by age group is in the 45 and over category. Here, in Q4 2013 the numbers unemployed declined only 8.6% y/y (down 6,900 in level terms). The good news is that this reversed the rise in unemployment in this category recorded in 12 months through Q4 2012 (+3.0% and +2,300). Compared to H1 2011, numbers unemployed in this age group are still higher (+2.8% and +2,000). Numbers of long-term unemployed dipped in Q4 2013 only slightly (by 6.7% or -3,700) and compared to H1 2011 long-term unemployment in this age category is still up +11.4% or +5,250.

So overall, these are pretty solid numbers,with core reading showing that total number of unemployed for age 15 and over is currently at the lowest level for any Q4 period since (and including) Q4 2009.

Lastly, on severity of long-term unemployment, consider the chart plotting percentage of long-term unemployed in each age group total unemployment numbers:


This clearly shows that since around H2 2012, the positive trends in overall unemployment are broadly translating into symmetric reductions in unemployment for both short-term and long-term unemployed for all age groups. Again, this is a positive trend in the short run, as long-term unemployment is the hardest (or the stickiest) of all forms of unemployment and we can expect an upward trend in these charts. This was indeed the case in the period prior to H2 2012. Since then, however, we are seeing reductions in unemployment of relatively similar proportions for short-term and long-term unemployed.