Showing posts with label #COVIDBrazil. Show all posts

Friday, July 3, 2020

3/7/20: Services & Composite PMIs Q2 2020: BRIC


Note: charts below are not updated for full 2Q 2020 data on Global Services and Composite PMIs, which are yet to be reported for June and thus cover April-May period only. I will update these later.

Starting with Services sector activity:


BRIC Services index fell from a deeply recessionary 44.9 reading for 1Q 2020 to 40.9 in 2Q 2020, signalling accelerated rate of contraction in the sector across the four emerging markets economies. 1Q 2020 is now the second lowest quarter of index performance on the record, with 2Q 2020 coming in as the worst quarter on the record.

China was the strongest performer, with 2Q 2020 index at 52.6, four quarters high, and statistically in a relatively robust growth territory. Historically, this reading is consistent with GDP growth of 4-4.5 percent.

Russia recorded the second strongest reading, albeit at sharply recessionary 32.0 in 2Q 2020, down from the already recessionary 47.7 in 1Q 2020. 2Q 2020 is the lowest reading on record for Russian Services sectors. So being second wins no prizes.

Brazil Services PMI fell from a sharply recessionary 45.9 in 1Q 2020 to an even more depressing 30.3 in 2Q 2020. Needless to say, 2Q 2020 is the worst reading in Brazil Services PMI history.

India Services PMI has been signalling an outright collapse of economic activity in 2Q 2020, having fallen to 17.2 against 1Q 2020 reading of 54.1. The economy is literally paralysed.

In the entire history of BRICs PMIs, there has been only one other instance of two consecutive sub-50 readings - in 4Q 2008 and 1Q 2009, when the two-quarters average of the index was 47.7. Current index reading has !Q-2Q 2020 average of 42.6.

Given the above and the Manufacturing PMIs (covered here: https://trueeconomics.blogspot.com/2020/07/1720-manufacturing-pmis-q2-2020-bric.html), BRICs Composite Indices (note: I am using Markit data and relative GDP weights for each economy) have been woeful as well.


Brazil Composite average for 1Q 2020 was at 46.9. This fell to 31.8 in 2Q 2020. A recession in 1Q 2020 has accelerated dramatically into 2Q 2020 across all sectors of the economy.

Russia Composite average in 2Q 2020 was at 32.6, marginally better than that of Brazil, and well below already-recessionary reading of 47.7 in 1Q 2020. This, too, signals accelerating collapse of the economy.

India Composite index was in the expansionary territory at 54.8 in 1Q 2020 and it fell to an abysmally low 19.9 in 2Q 2020, indicating that the country economy came to a standstill in April-June. This is the lowest Composite index reading on record for any BRIC economy.

China Composite index fell from 52.6 in 4Q 2019 to a contractionary 42.0 in 1Q 2020, before recovering back to 52.6 in 2Q 2020. If treated symmetrically, this means that the Chinese economy did not fully recover to pre-crisis growth rates in 2Q 2020, but has made some progress on the path to recovery. There are multiple caveats that apply to this analysis, however, so treat it as purely directionally-indicative, as opposed to a measure of actual magnitudes.

As noted earlier, I will update these charts in subsequent posts, once we have Global PMIs reproted.

Wednesday, July 1, 2020

1/7/20: COVID19 Update: Three Charts on COVID19 Developments in Major Emerging Markets


Via Danske Bank Research, three really neat sets of visualizations for abating COVID19 crisis dynamics in major emerging markets:


Note: the number of tests per capita in Russia is in part explaining the lower death rates from COVID19 there. Russia runs earlier testing and interventions, leading to longer stays in hospitals, higher hospitalization rates with lower ICU use rates, allowing for earlier interventions. However, Russia also produces death statistics for COVID19 that are different in methodology to the EU27 standards. Specifically, Russia claims to carry out more autopsies in cases of all deaths, allowing it to attribute deaths to primary causes, e.g. cardiac failures, that may have COVID19 as underlying trigger.

1/7/20: Manufacturing PMIs Q2 2020: BRIC


BRIC economies reported their June manufacturing PMIs, so we can update Q2 2020 data. Here is the chart:


Despite improving PMIs in all BRIC economies through June 2020, quarterly readings remains deeply recessionary in all BRICs except for China.

  • Brazil Manufacturing PMI averaged 40.6 in 2Q 2020 down from 1Q reading of 50.6. Brazil Manufacturing sector growth was slowing down from the start of 4Q 2019 and was showing anaemic growth (statistically, zero growth) in 1Q 2020 before COVID19 restrictions kicked in. June 2020 monthly reading rose, however, to 51.6 - signalling pretty robust growth on a monthly basis for the first time since the end of February. Some good news, but not enough to lift 2Q 2020 average above 50.0 mark.
  • Russia Manufacturing PMI remains below 50.0 in June, as it did consecutively since the end of April 2019. This marks 14 months of continued contraction, only accelerated by COVID19. Quarterly PMI for 2Q 2020 is deep under water at 39.0 - the worst reading in history, matching that of the lows of the 2009 recession in 1Q 2009. June monthly uptick to 49.4 is still leaving Russian Manufacturing index below zero growth mark of 50.0. 
  • India Manufacturing PMI rose from 30.8 in May to 47.2 in June 2020, but remains well below zero growth line. Quarterly index is now at 35.1 for 2Q 2020, which is an all-time low. 
  • China Manufacturing PMI was the only BRIC index to reach into positive growth territory in 2Q 2020, at 50.4. Statistically, this reading is indifferent from zero growth conditions in the sector, however. 
Overall, GDP-shares weighted BRIC Manufacturing index is at 45.0 in 2Q 2020, down from 49.1 in 1Q 2020. Not as bad as 4Q 2008 - 1Q 2009 readings of 43.1 and 43.7, respectively, but bad. Still, BRICs as a group managed to sustain less manufacturing decline than the Global Manufacturing index which collapsed to 43.6 in 2Q 2020 from 48.4 in 1Q 2020.

Sunday, June 28, 2020

28/6/20: COVID19 Update: Top 50 Countries


Here are summary tables of stats for COVID19 pandemic for top 50 countries by cumulative number of cases, plus EU27:

First a 'heat map' legend.


Friday, June 26, 2020

25/6/20: COVID19 Update: Global Pandemic Rates


Summary of global, G7, and BRIICS case and deaths counts and rates:


25/6/20: COVID19 Update: World Cases and Deaths


As explained in the charts: although geography of cases and deaths continues to shift to Latina America and Africa, Western nations are starting see pockets of increased cases. This is happening during the summer season in the Northern Hemisphere, making current increases more worrying.


The pandemic has not gone away. And any 'normalization' in these circumstances must be taken with extreme caution. Which is, currently, being abandoned more than adhered to.

Saturday, June 20, 2020

20/6/20: World COVID Data Update: The Theory of Back to Normal


Relaxation of the Covid19 pandemic restrictions is gaining momentum worldwide, with clusters of renewed concerns over the 'second peak' or 'second wave' dynamics. The problem is that global pandemic numbers remain extremely worrying:

Total new cases are hitting all-time highs:


The orange box represents, roughly, the range of earlier data that triggered the lockdowns. It is clear that worldwide numbers are sustainably above that range. The 7-day running average is horrific and trending up at an accelerating rate. The slope of the current 7-day moving average is now similar to what we observed in the peak period of contagion in Europe.

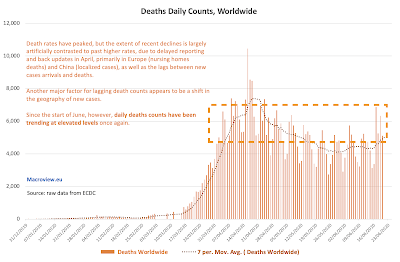
Total daily deaths are also on the rise, once again:


Once again, the orange box related current deaths to the European lockdowns initiation deaths. The 7-day moving average is on the rise, once again.

Yes, on per-capita basis, the pandemic has moderated, primarily due to different geographies of concentration of new cases and new deaths. However, European lockdowns periods coincided with more robust testing in Europe and in advanced economies in Asia, while current period of globally spiking cases and rising deaths is coincident with less robust public health systems in less developed countries, implying that current numbers are most likely coming from much larger underestimates of actual cases and deaths.

Wednesday, June 3, 2020

3/6/20: BRIC Composite PMIs for 2Q 2020


Having covered Manufacturing PMIs for 2Q 2020 for the BRIC economies here: https://trueeconomics.blogspot.com/2020/06/1620-3-months-of-covid19-impact-bric.html and Services PMIs here: https://trueeconomics.blogspot.com/2020/06/3620-bric-services-pmi-may-2020.html, time to update charts for Composite PMIs.

Brazil Composite PMI for 2Q 2020 is currently running at 27.3, the lowest on record, and marking a major decline on 46.9 reading in 1Q 2020. This implies that Brazil economy is currently registering sharply contractionary growth indicators in two consecutive quarters from the start of 2020. 

Russia Composite PMI for 2Q 2020 currently stands at 24.5, also a historical low, marking second consecutive quarter of sub-50 readings. The last time Russian quarterly PMIs were statistically significantly below 50.0 was in 1Q and 2Q 2014. 

India Composite PMI for 2Q 2020 is currently registering the sharpest downturn of all BRIC economies at 11.0, down from strongly expansionary 54.8 in 1Q 2020. This marks the sharpest fall-off on pre-COVID19 reading for any BRIC economy and signals that the Indian economy is effectively stoped functioning.

China is the only BRIC economy so far to show signs of post-pandemic recovery. China 2Q 2020 Composite PMI is currently running at 51.1 which is statistically above 50.0 marker, signalling weak, but positive expansion. Still, 51.1 marks the second slowest growth reading in the Chinese economy since 2Q 2016. 


As the chart above indicates, Brazil, Russia and India all are currently running 2Q 2020 Composite PMIs below the Global Composite PMI (which is at 31.25 as of the end of May), while China Composite PMI is running well-ahead of the Global Composite PMI.

3/6/20: BRIC Services PMI: May 2020


Services PMIs for BRIC economies are out today, so we can updated 2Q figures to include data for May. The latest monthly print imply slight moderation in the economic contraction in Brazil, India and Russia, with return to Services sector growth in China. This marks the first month since end of January with China posting positive growth in Services (reading of PMI above 50).


Brazil Services PMI was statistically unchanged in May at 27.6, compared to April 27.4 reading. Last time the Brazilian Services sectors posted PMI reading consistent with no contraction (at 50.4 - statistically zero growth) was back in February 2020. Current running average PMI for 2Q 2020 is at 27.5, marking the lowest reading on record.

Russia Services PMI was up from an absolutely disastrous 12.2 reading in April to a somewhat less disastrous reading of 35.9 in May. The index has been at at 37.1 in March. 2Q index reading so far is at 24.1, an absolute historical low, marking the second quarter in a row of sub-50 indicator readings, consistent with sharp contraction.

China Services PMI was the only BRIC Services indicator that managed to reach above 50 in May. May index at 55.0 was consistent with a major recovery momentum compared to 44.4 recorded in April. At 49.7, however, the 2Q figure is still outside positive growth territory.

India Services PMI continued to show fundamental weaknesses in the economy. May Services PMI reading of 12.6 was an improvement on April reading of 5.4, but 2Q 2020 reading is currently at 9.0. 1Q 2020 Services activity reading was at 54.1, implying that Indian services activity has literally stopped on the dime in April-May 2020.

Overall, BRIC 2Q 2020 Services PMI is currently at 35.7, down from 1Q 2020 reading of 44.9. 2Q 2020 is currently the lowest quarterly PMI reading for BRIC in history.


I have covered BRIC Manufacturing PMIs for May 2020 here: https://trueeconomics.blogspot.com/2020/06/1620-3-months-of-covid19-impact-bric.html.

2/6/20: COVID19 Update: Worldwide Numbers


Updating through June 2, 2020 ECDC data:

Daily counts are accelerating on-trend with no trend inversion and close to historical peaks:


Death counts are lagging daily counts, but persistent decline in counts over the previous weeks has now been arrested:

While advanced economies are seeing sustained improvements in the cases counts and deaths counts reported daily, emerging and developing economies now lead new counts and new deaths growth.

Brazil has now overtaken Russia to take the second place in the world in the number of overall cases detected. The U.S. continues to lead.